Contents
- 1 Overview
- 2 Technologies used
- 3 Steps
- 4 Workflow
- 5 Config ELK
- 6 Config Springboot program
- 7 Config Kibana
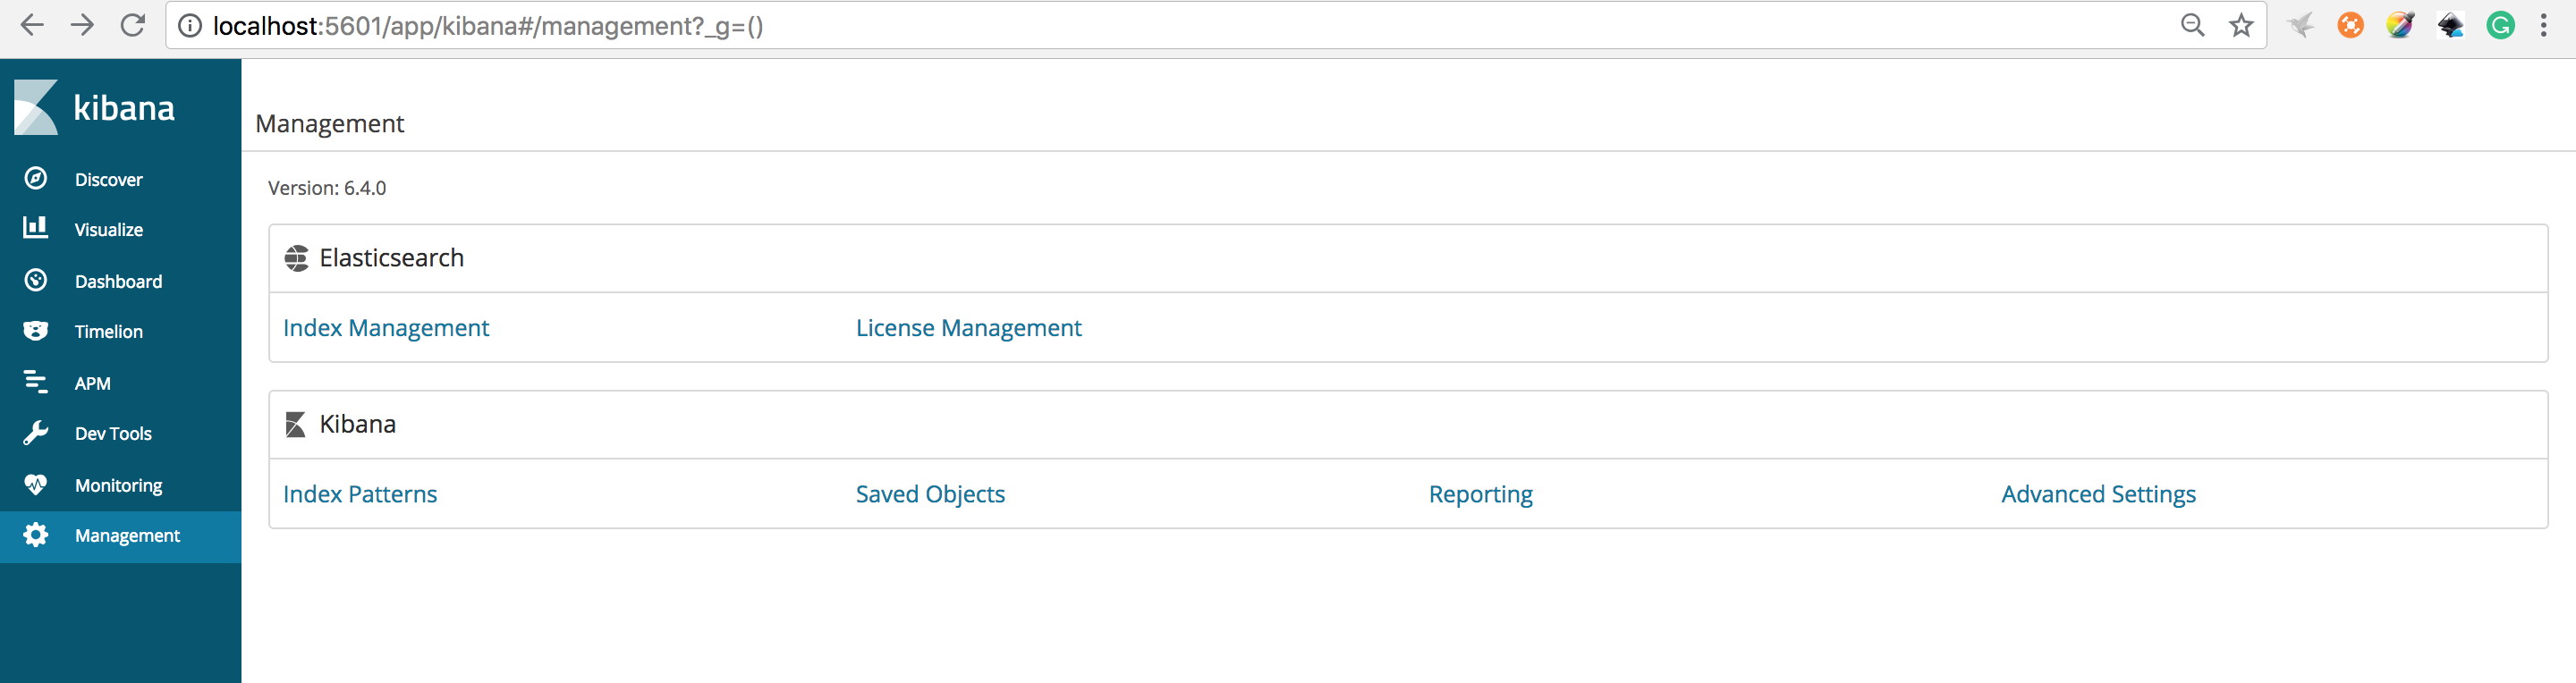
- 7.0.1 Open Kibana at http://localhost:5601 and create a new index for the application and choose Management->index Patterns->Create Index Pattern
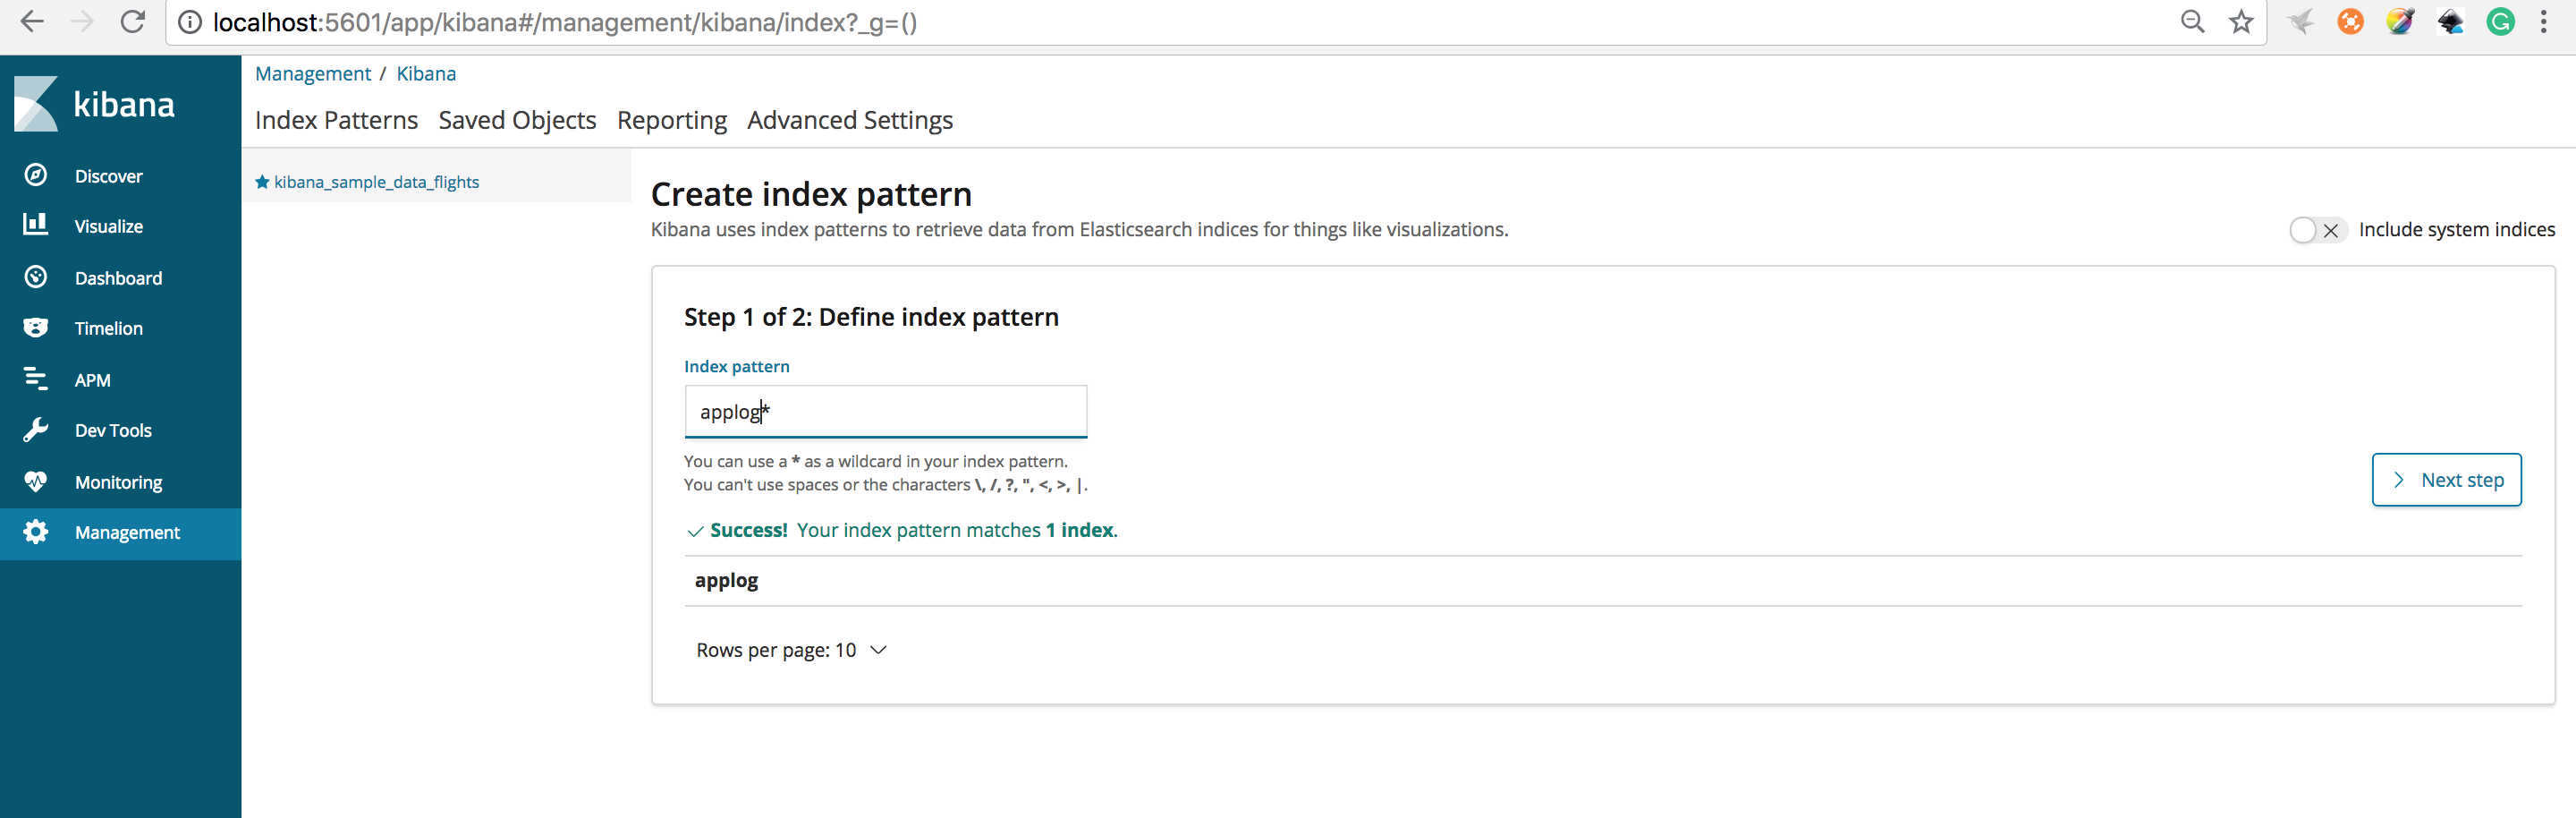
- 7.0.2 Type applog* in the textbook and then click Next step
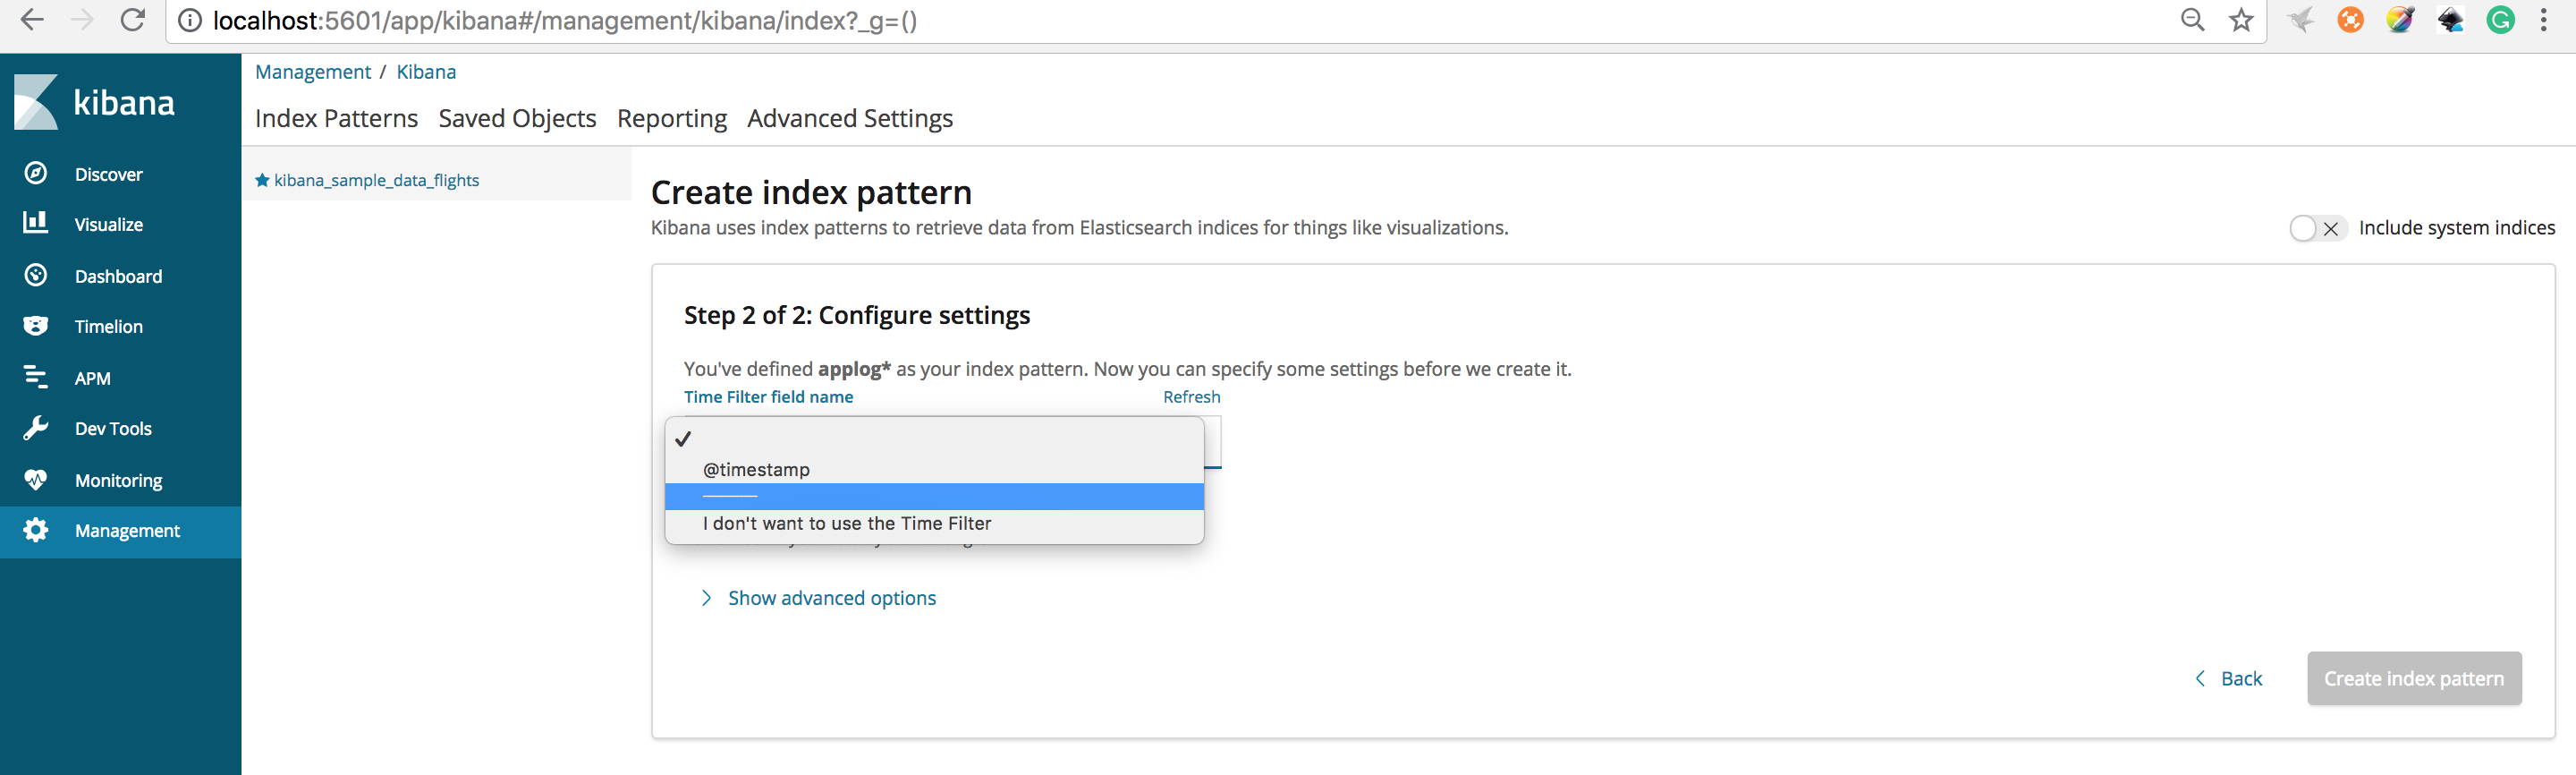
- 7.0.3 Choose @timestamp in the dropdown list and click Create Index pattern
- 7.0.4 Choose applog in the up left search box and you will see the result like this below
- 8 Source code
Overview
This tutorial will show you how to integrate Springboot application with ELK.
Springboot application will create some log messages and send them to ELK.
Find more tutorials on Andrew Programming
Technologies used
- Elasticsearch
- Kibana
- Logstash
- Springboot
- Maven
- JDK 1.8
Steps
- Setup Elasticsearch
- Setup Kibana
- Setup Logstash
- Create a new Springboot application
- Integrate them together
Workflow
Config ELK
- Go to the office website and download the needed component one by one
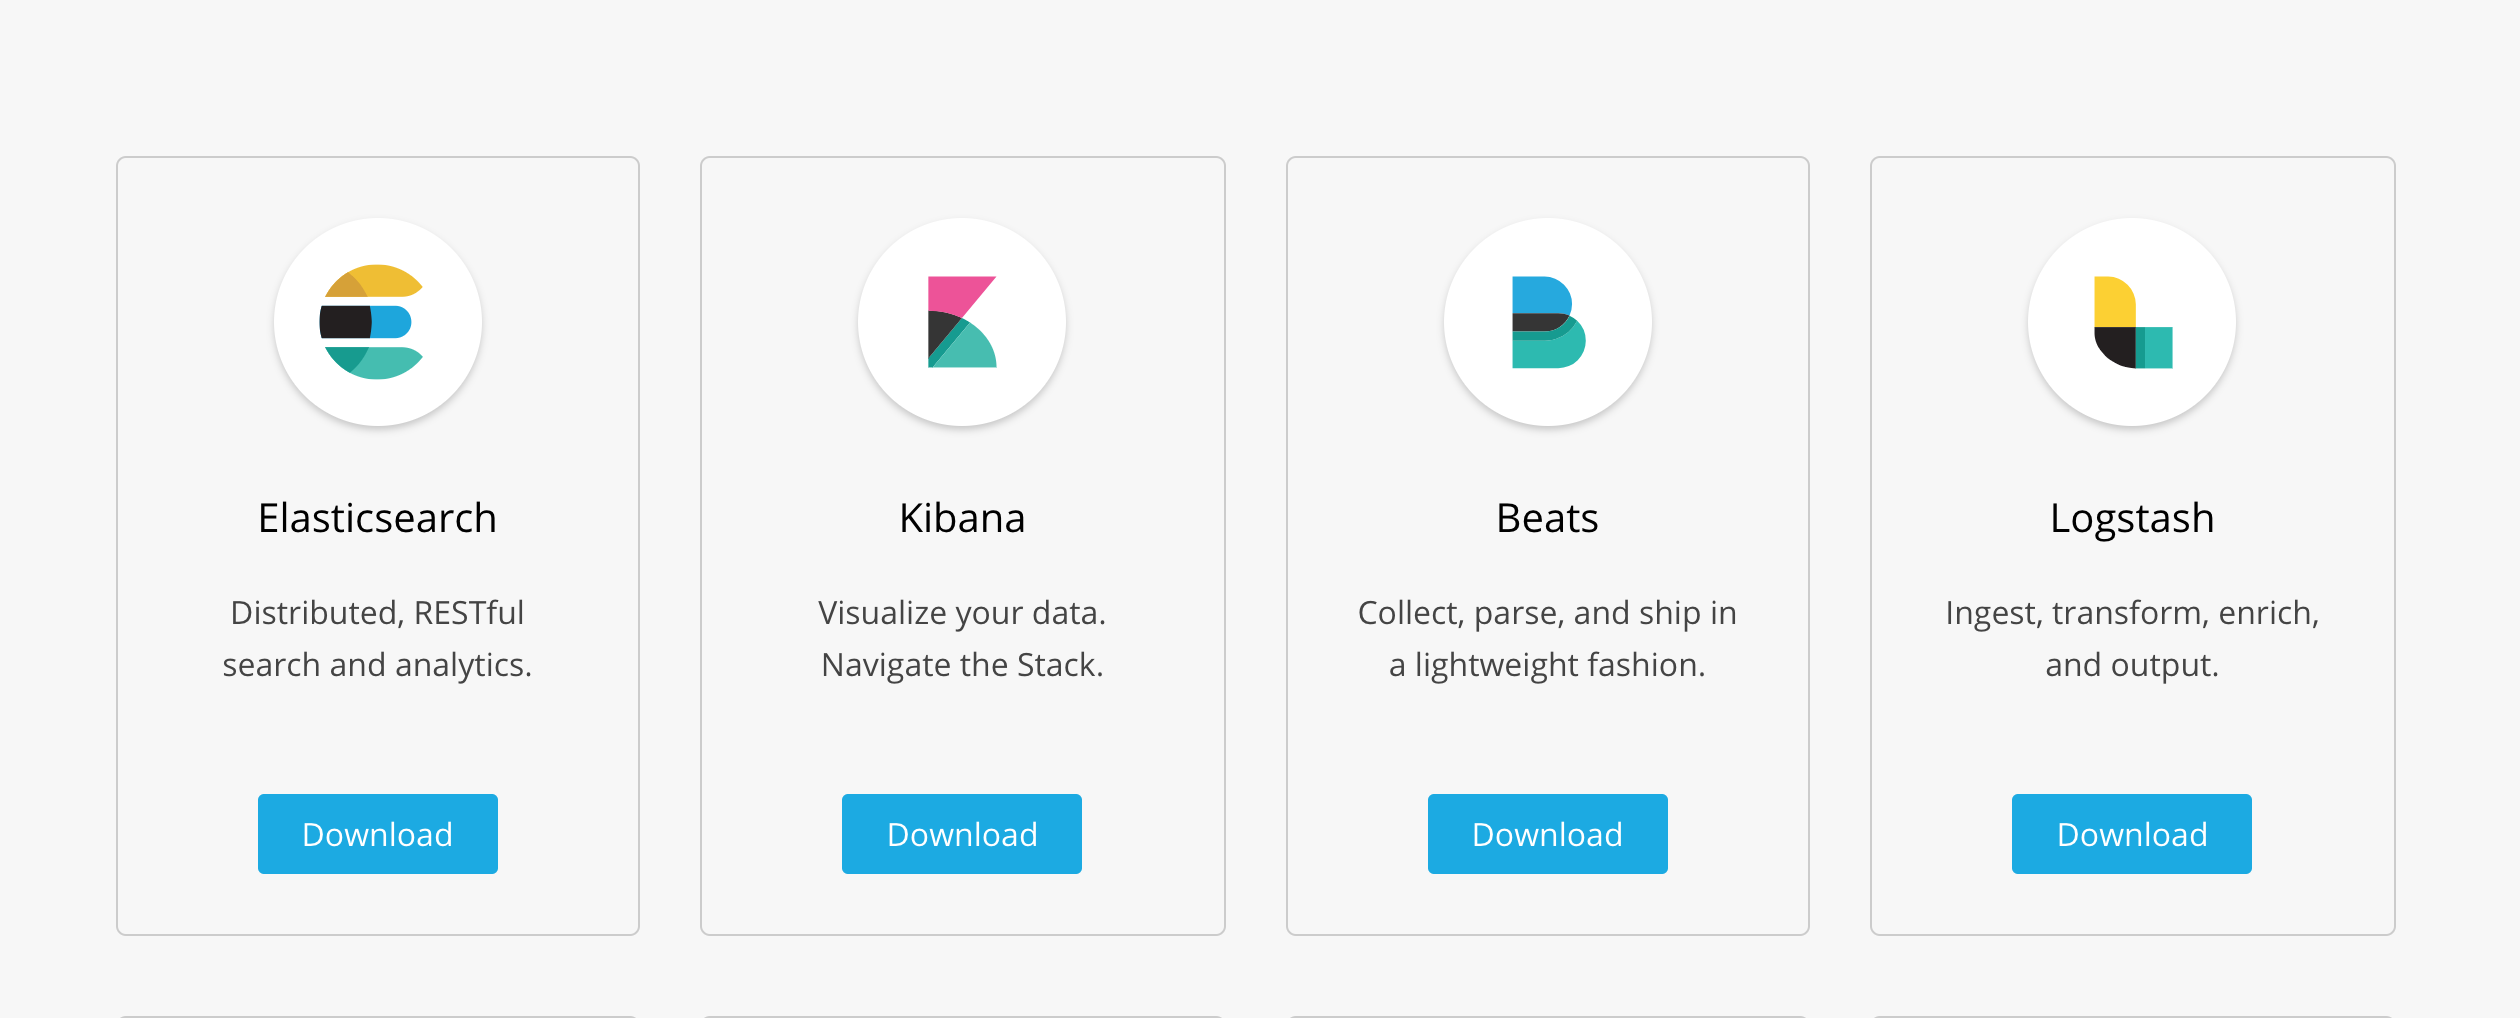
For each product dive into the Download page and follow the instruction to install them.Install order should be :
- Elasticsearch
- Kibana
- Logstash
- Create a new file springboot-log-demo.conf under the /config/. Below is the file in my Mac:

- Start running Logstash with command
bin/logstash -f springboot-log-demo.confwith content below:-
input {
  tcp {
      port => 4560
      codec => json_lines
  }
}
output{
elasticsearch {
   hosts => ["localhost:9200"]
   index => "applog"
}
stdout { codec => rubydebug }
}
-
Running Result

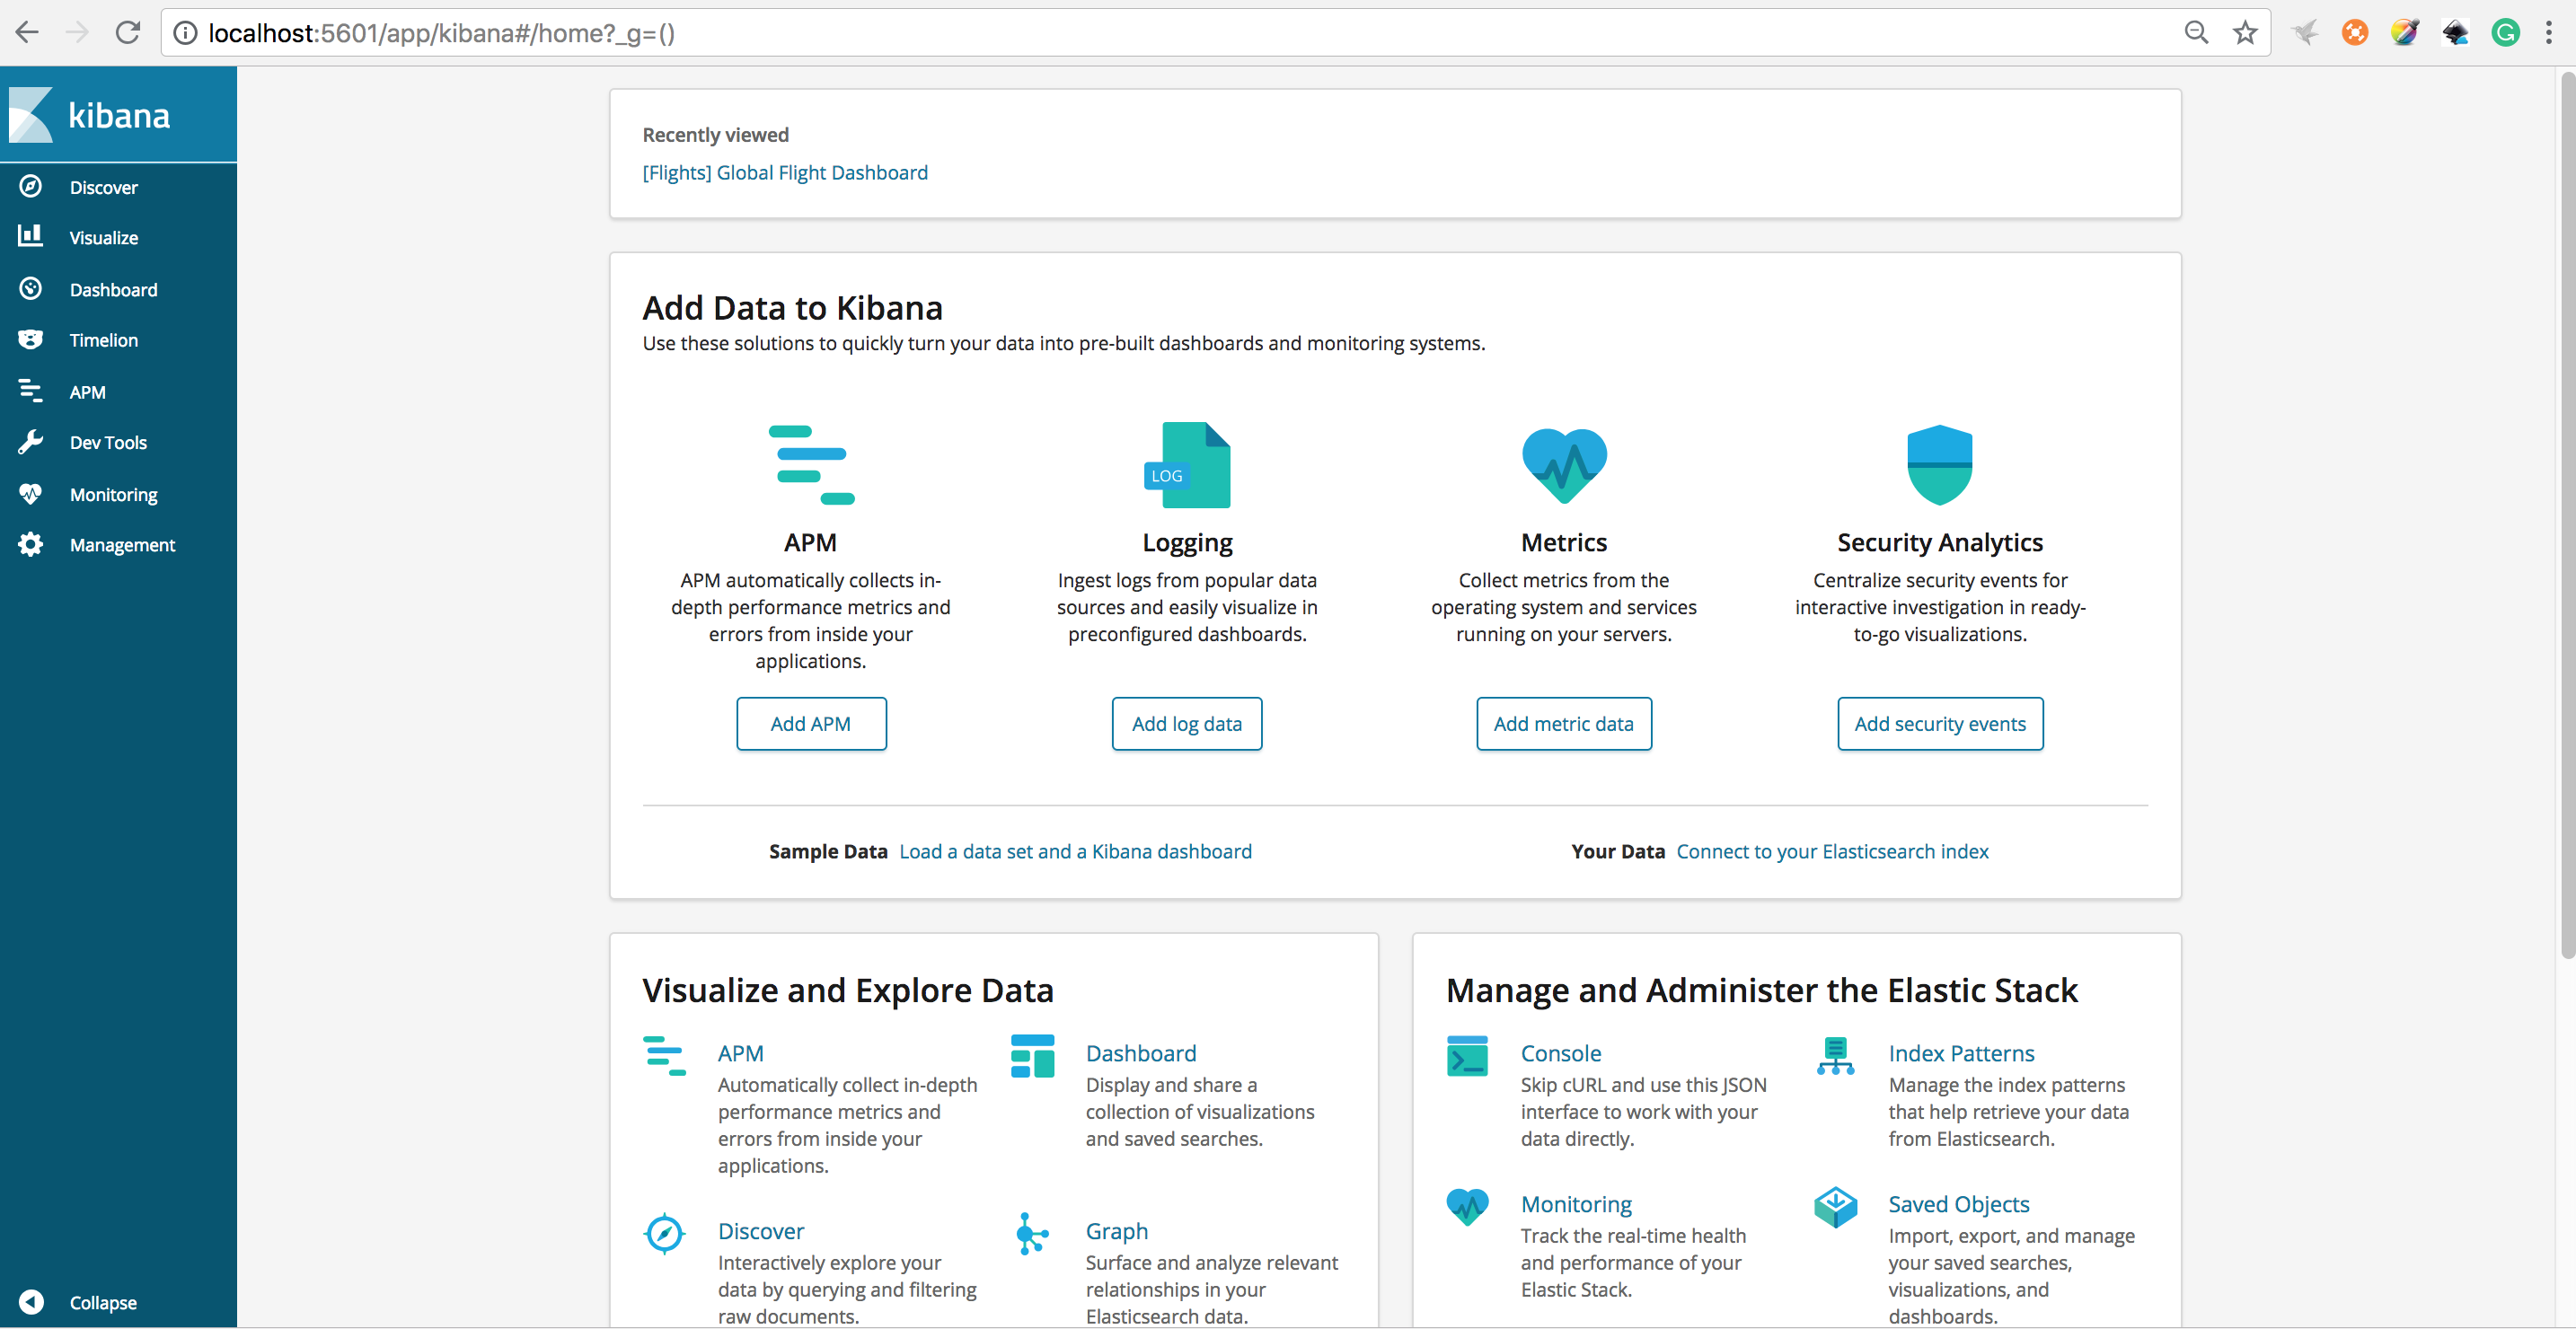
Once everything is done you can browse the Kibana by visiting http://localhost:5601 and you should see below page:
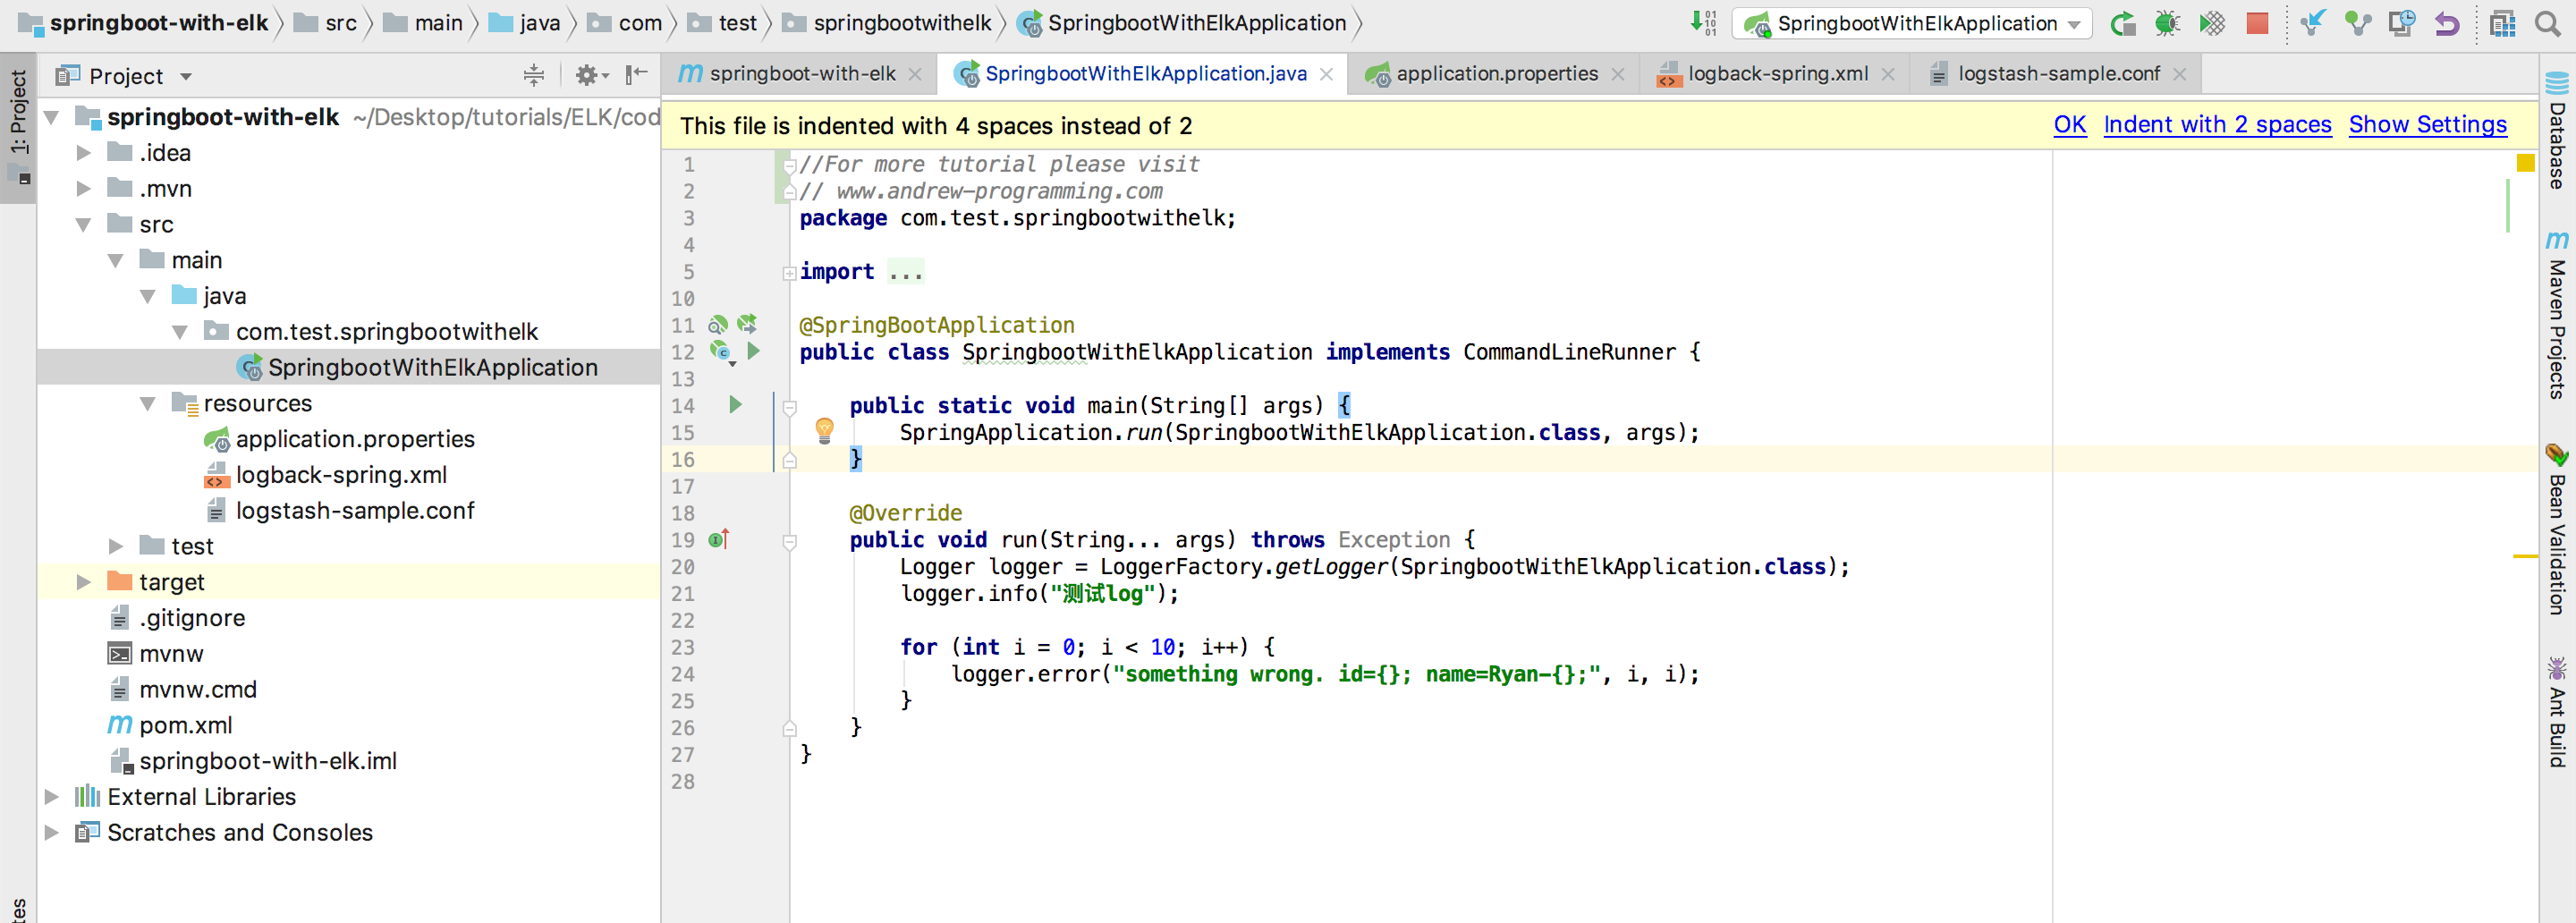
Config Springboot program
Project structure
logback-spring.xml
<?xml version="1.0" encoding="UTF-8"?>
<!DOCTYPE configuration>
<configuration>
  <appender name="LOGSTASH" class="net.logstash.logback.appender.LogstashTcpSocketAppender">
    <destination>localhost:4560</destination>
    <encoder charset="UTF-8" class="net.logstash.logback.encoder.LogstashEncoder" />
  </appender>

  <include resource="org/springframework/boot/logging/logback/base.xml"/>

  <root level="INFO">
    <appender-ref ref="LOGSTASH" />
    <appender-ref ref="CONSOLE" />
  </root>

</configuration>
pom.xml
<?xml version="1.0" encoding="UTF-8"?>
<project xmlns="http://maven.apache.org/POM/4.0.0" xmlns:xsi="http://www.w3.org/2001/XMLSchema-instance"
 xsi:schemaLocation="http://maven.apache.org/POM/4.0.0 http://maven.apache.org/xsd/maven-4.0.0.xsd">
 <modelVersion>4.0.0</modelVersion>

 <groupId>com.test</groupId>
 <artifactId>springboot-with-elk</artifactId>
 <version>0.0.1-SNAPSHOT</version>
 <packaging>jar</packaging>

 <name>springboot-with-elk</name>
 <description>Demo project for Spring Boot</description>

 <parent>
  <groupId>org.springframework.boot</groupId>
  <artifactId>spring-boot-starter-parent</artifactId>
  <version>2.0.2.RELEASE</version>
  <relativePath/> <!-- lookup parent from repository -->
 </parent>

 <properties>
  <project.build.sourceEncoding>UTF-8</project.build.sourceEncoding>
  <project.reporting.outputEncoding>UTF-8</project.reporting.outputEncoding>
  <java.version>1.8</java.version>
 </properties>

 <dependencies>
  <dependency>
   <groupId>org.springframework.boot</groupId>
   <artifactId>spring-boot-starter-web</artifactId>
  </dependency>
  <dependency>
   <groupId>net.logstash.logback</groupId>
   <artifactId>logstash-logback-encoder</artifactId>
   <version>5.1</version>
  </dependency>
  <dependency>
   <groupId>org.springframework.boot</groupId>
   <artifactId>spring-boot-devtools</artifactId>
   <scope>runtime</scope>
  </dependency>
  <dependency>
   <groupId>org.springframework.boot</groupId>
   <artifactId>spring-boot-starter-test</artifactId>
   <scope>test</scope>
  </dependency>
 </dependencies>

 <build>
  <plugins>
   <plugin>
    <groupId>org.springframework.boot</groupId>
    <artifactId>spring-boot-maven-plugin</artifactId>
   </plugin>
  </plugins>
 </build>

</project>
Run the application you should see output like this below in Logstash terminal
[2018-09-17T14:43:26,574][WARN ][logstash.runner          ] SIGINT received. Shutting down.
[2018-09-17T14:43:31,357][INFO ][logstash.pipeline        ] Pipeline has terminated {:pipeline_id=>"main", :thread=>"#<Thread:0x3bedfdd3 run>"}
localhost:logstash-6.4.0 andrew$ ./bin/logstash -f config/springboot-log-demo.conf
Sending Logstash logs to /Users/andrew/Desktop/software/elk/logstash-6.4.0/logs which is now configured via log4j2.properties
[2018-09-17T14:43:52,156][WARN ][logstash.config.source.multilocal] Ignoring the 'pipelines.yml' file because modules or command line options are specified
[2018-09-17T14:43:52,640][INFO ][logstash.runner          ] Starting Logstash {"logstash.version"=>"6.4.0"}
[2018-09-17T14:43:55,378][INFO ][logstash.pipeline        ] Starting pipeline {:pipeline_id=>"main", "pipeline.workers"=>8, "pipeline.batch.size"=>125, "pipeline.batch.delay"=>50}
[2018-09-17T14:43:55,801][INFO ][logstash.outputs.elasticsearch] Elasticsearch pool URLs updated {:changes=>{:removed=>[], :added=>[http://localhost:9200/]}}
[2018-09-17T14:43:55,811][INFO ][logstash.outputs.elasticsearch] Running health check to see if an Elasticsearch connection is working {:healthcheck_url=>http://localhost:9200/, :path=>"/"}
[2018-09-17T14:43:56,083][WARN ][logstash.outputs.elasticsearch] Restored connection to ES instance {:url=>"http://localhost:9200/"}
[2018-09-17T14:43:56,137][INFO ][logstash.outputs.elasticsearch] ES Output version determined {:es_version=>6}
[2018-09-17T14:43:56,140][WARN ][logstash.outputs.elasticsearch] Detected a 6.x and above cluster: the `type` event field won't be used to determine the document _type {:es_version=>6}
[2018-09-17T14:43:56,165][INFO ][logstash.outputs.elasticsearch] New Elasticsearch output {:class=>"LogStash::Outputs::ElasticSearch", :hosts=>["//localhost:9200"]}
[2018-09-17T14:43:56,180][INFO ][logstash.outputs.elasticsearch] Using mapping template from {:path=>nil}
[2018-09-17T14:43:56,205][INFO ][logstash.outputs.elasticsearch] Attempting to install template {:manage_template=>{"template"=>"logstash-*", "version"=>60001, "settings"=>{"index.refresh_interval"=>"5s"}, "mappings"=>{"_default_"=>{"dynamic_templates"=>[{"message_field"=>{"path_match"=>"message", "match_mapping_type"=>"string", "mapping"=>{"type"=>"text", "norms"=>false}}}, {"string_fields"=>{"match"=>"*", "match_mapping_type"=>"string", "mapping"=>{"type"=>"text", "norms"=>false, "fields"=>{"keyword"=>{"type"=>"keyword", "ignore_above"=>256}}}}}], "properties"=>{"@timestamp"=>{"type"=>"date"}, "@version"=>{"type"=>"keyword"}, "geoip"=>{"dynamic"=>true, "properties"=>{"ip"=>{"type"=>"ip"}, "location"=>{"type"=>"geo_point"}, "latitude"=>{"type"=>"half_float"}, "longitude"=>{"type"=>"half_float"}}}}}}}}
[2018-09-17T14:43:56,240][INFO ][logstash.inputs.tcp      ] Starting tcp input listener {:address=>"0.0.0.0:4560", :ssl_enable=>"false"}
[2018-09-17T14:43:56,480][INFO ][logstash.pipeline        ] Pipeline started successfully {:pipeline_id=>"main", :thread=>"#<Thread:0x29868c3c sleep>"}
[2018-09-17T14:43:56,515][INFO ][logstash.agent           ] Pipelines running {:count=>1, :running_pipelines=>[:main], :non_running_pipelines=>[]}
[2018-09-17T14:43:56,712][INFO ][logstash.agent           ] Successfully started Logstash API endpoint {:port=>9600}
{
          "level" => "INFO",
    "level_value" => 20000,
       "@version" => "1",
           "host" => "localhost",
    "logger_name" => "org.springframework.jmx.export.annotation.AnnotationMBeanExporter",
    "thread_name" => "Thread-16",
        "message" => "Unregistering JMX-exposed beans on shutdown",
     "@timestamp" => 2018-09-17T06:44:32.829Z,
           "port" => 54215
}
{
          "level" => "INFO",
    "level_value" => 20000,
       "@version" => "1",
           "host" => "localhost",
    "logger_name" => "org.springframework.boot.web.servlet.context.AnnotationConfigServletWebServerApplicationContext",
    "thread_name" => "Thread-16",
        "message" => "Closing org.springframework.boot.web.servlet.context.AnnotationConfigServletWebServerApplicationContext@78f54dc4: startup date [Mon Sep 17 14:39:34 CST 2018]; root of context hierarchy",
     "@timestamp" => 2018-09-17T06:44:32.815Z,
           "port" => 54215
}
                                                                                                                                        ...

{
          "level" => "INFO",
    "level_value" => 20000,
       "@version" => "1",
           "host" => "localhost",
    "logger_name" => "com.test.springbootwithelk.SpringbootWithElkApplication",
    "thread_name" => "restartedMain",
        "message" => "Starting SpringbootWithElkApplication on localhost with PID 59263 (/Users/andrew/Desktop/tutorials/ELK/code/springboot-with-elk/target/classes started by andrew in /Users/andrew/Desktop/tutorials/ELK/code/springboot-with-elk)",
     "@timestamp" => 2018-09-17T06:44:35.216Z,
           "port" => 54227
}
Config Kibana
Open Kibana at http://localhost:5601 and create a new index for the application and choose Management->index Patterns->Create Index Pattern
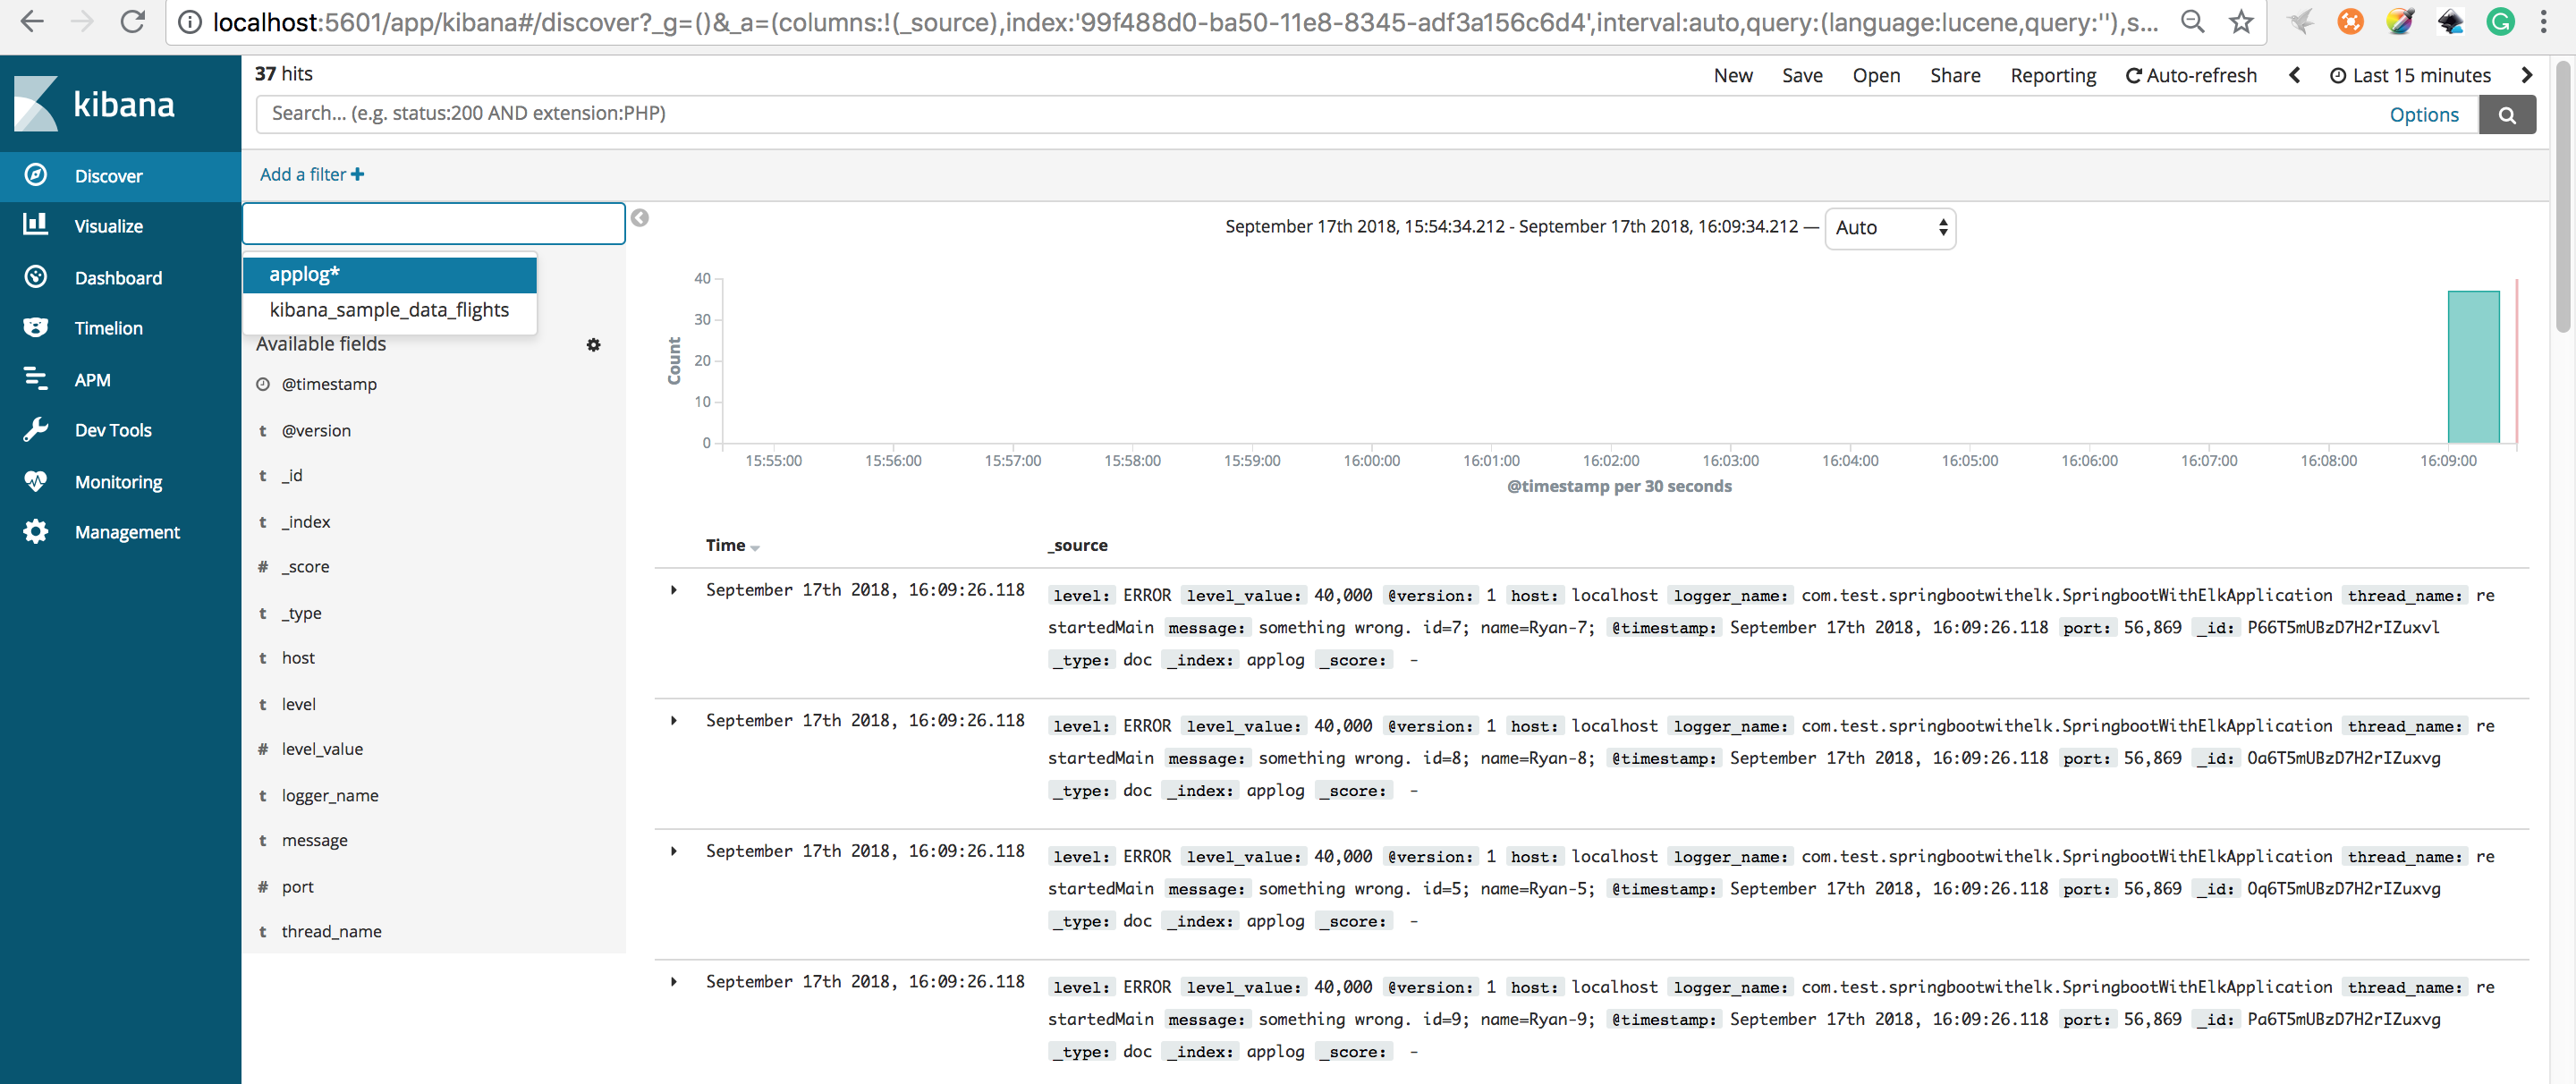
Type applog* in the textbook and then click Next step
Choose @timestamp in the dropdown list and click Create Index pattern
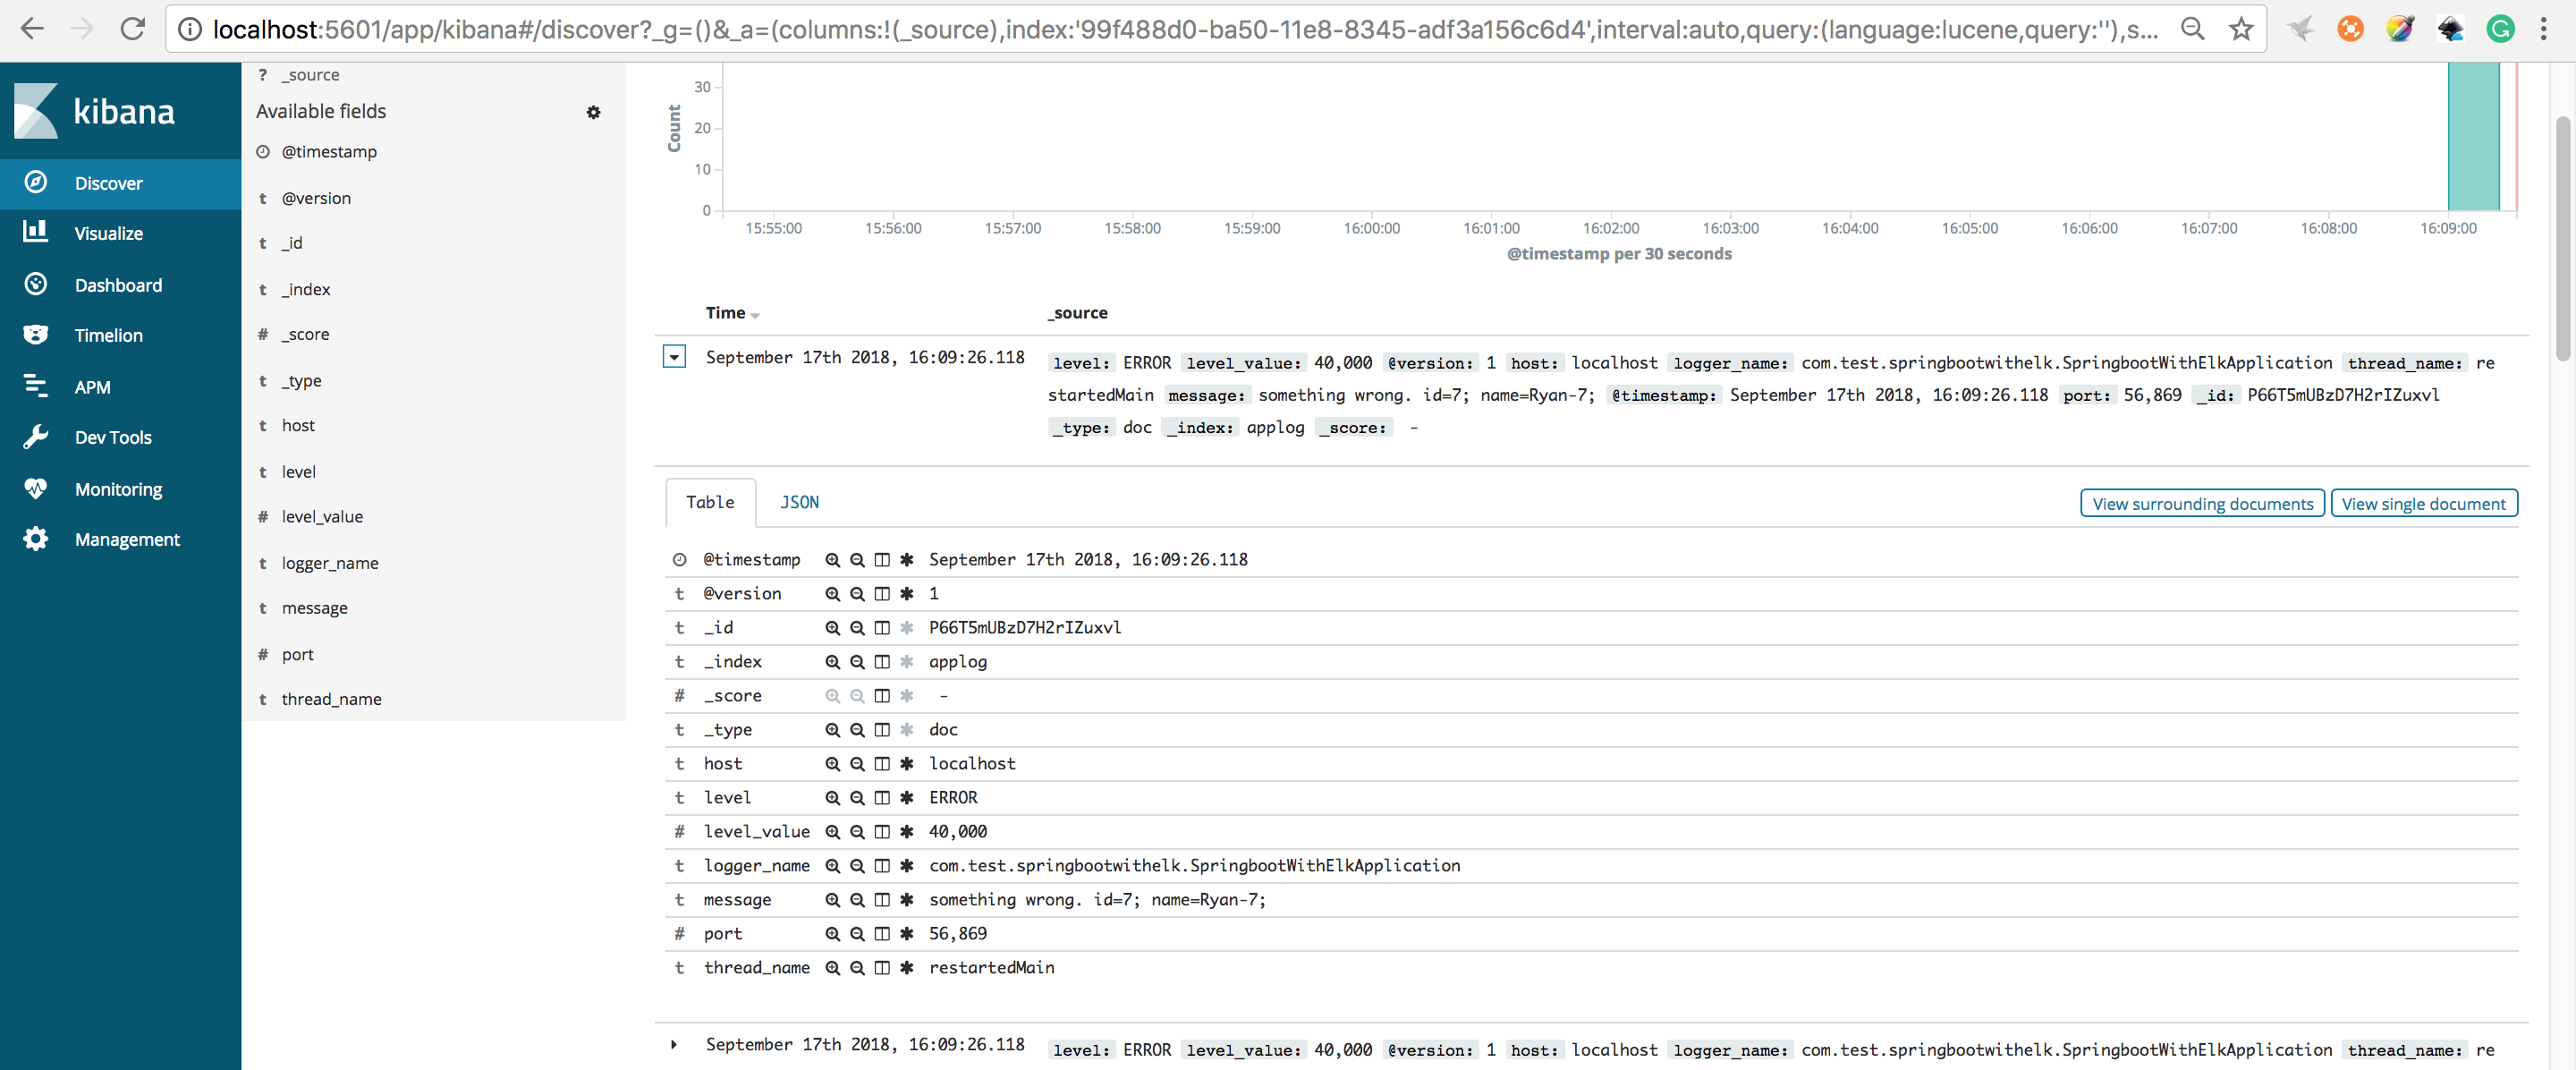
Choose applog in the up left search box and you will see the result like this below