Contents
Overview
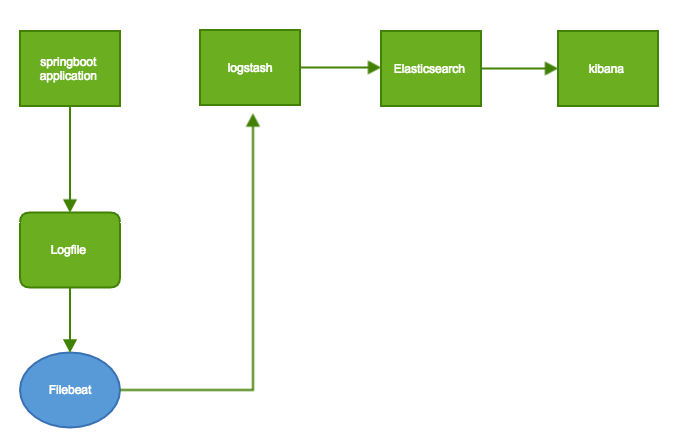
This tutorial will show you how to integrate the Springboot application with ELK and Filebeat.
Springboot application will create some log messages to a log file and Filebeat will send them to Logstash and Logstash will send them to Elasticsearch and then you can check them in Kibana.
Find more tutorials on http://www.andrew-programming.com
Technologies used
- Elasticsearch version: 6.4.0
- Kibana version: 6.4.0
- Logstash version: 6.4.0
- Filebeat version: 6.4.0
- Springboot
- Maven
- JDK 1.8
Steps
- Setup Elasticsearch
- Setup Kibana
- Setup Logstash
- Setup Filebeat
- Create a new Springboot application
- Integrate them together
Workflow
Config ELK
Go to the office website and download the needed component one by one
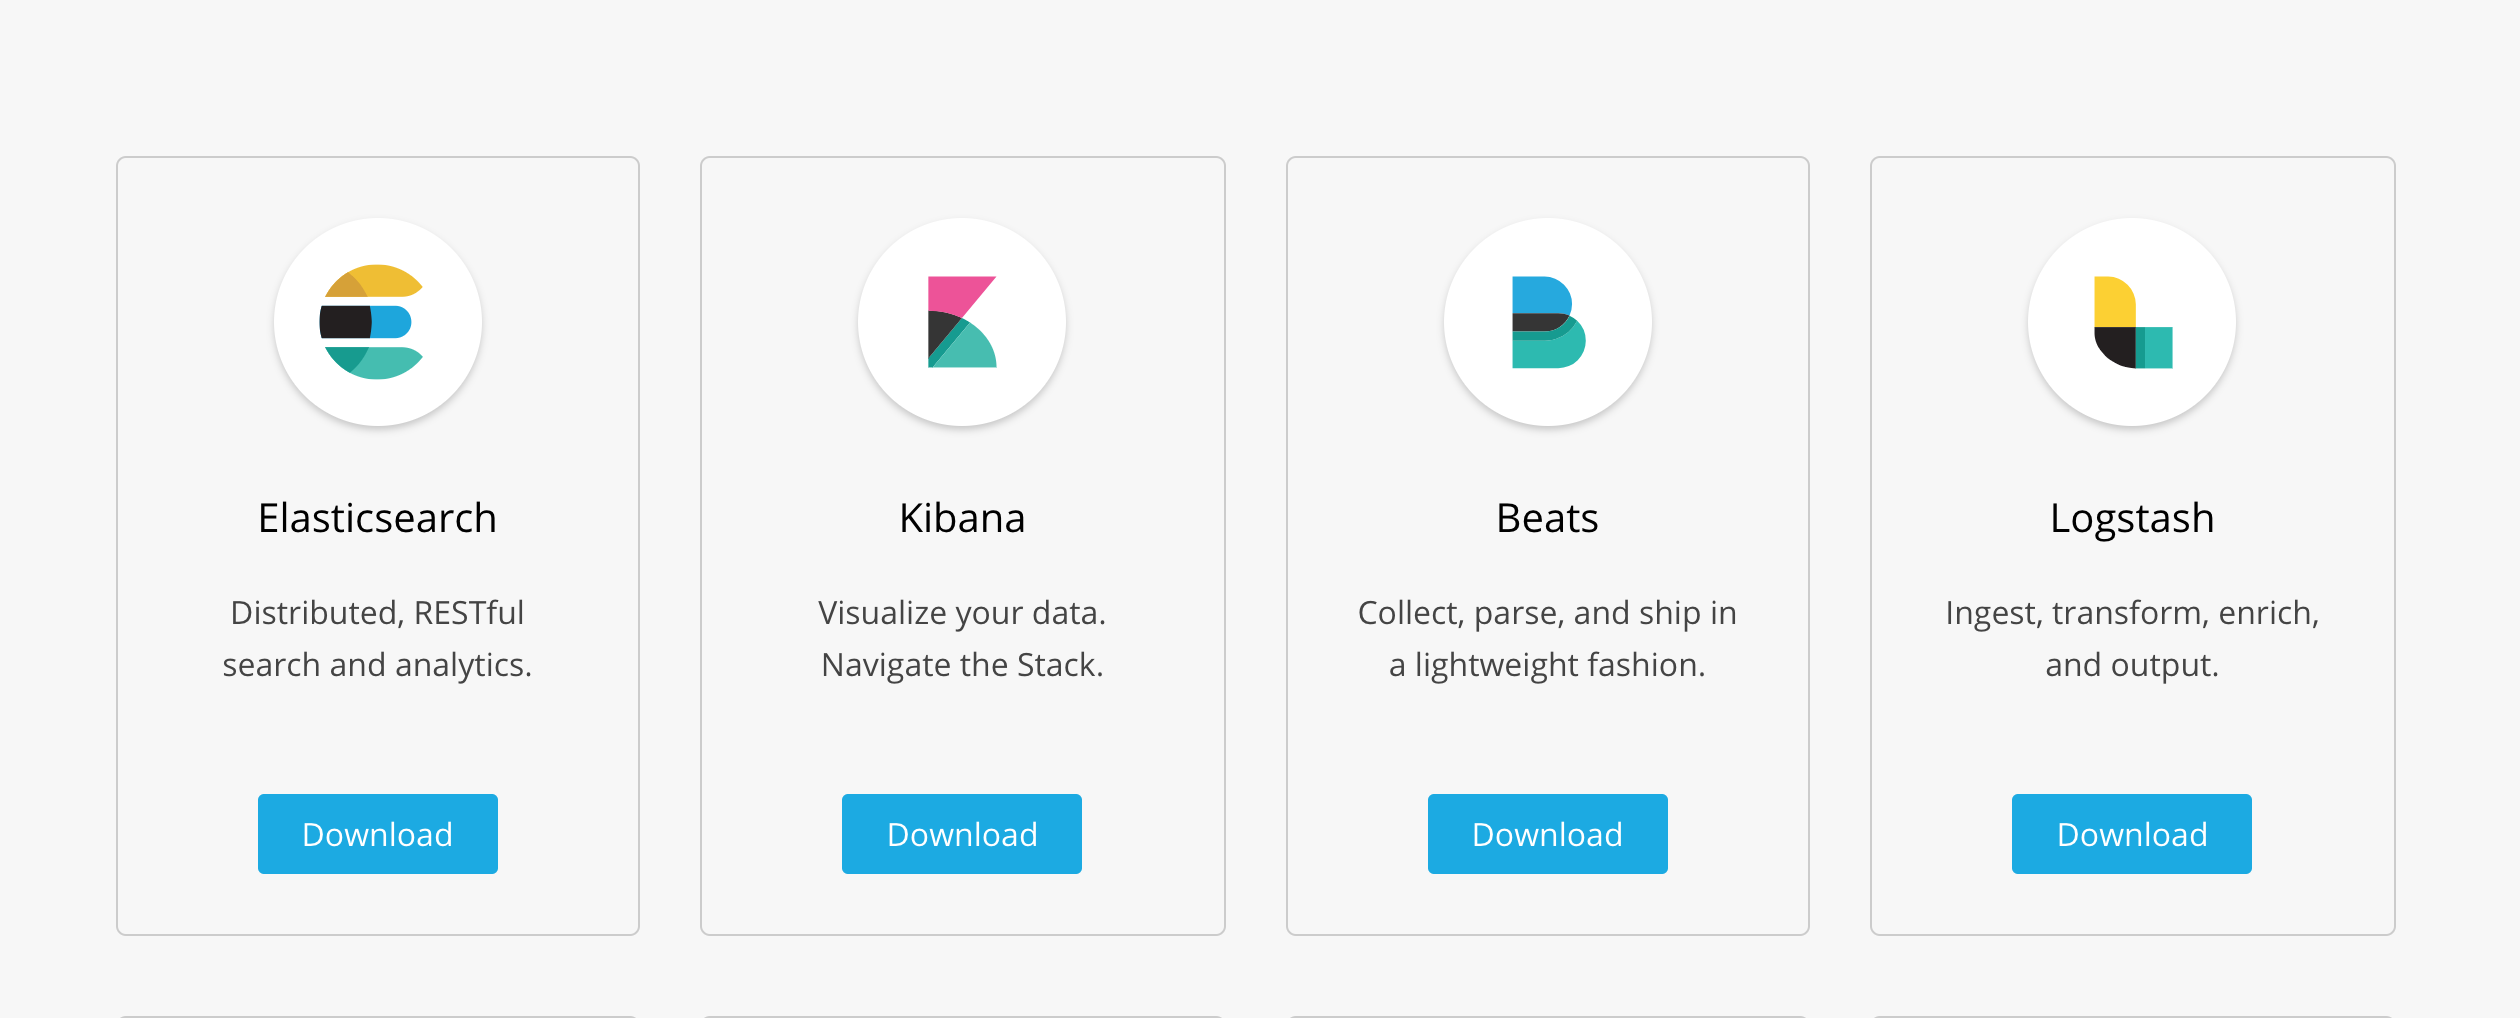
For each product dive into the Download page and follow the instruction to install them.
Install Order should be :
- Elasticsearch
- Kibana
- Logstash
- Create a new file spring-boot-log-demo.conf under the /config/ with content below:
-
input {
  tcp {
  port => 4560
  codec => json_lines
  }
  beats {
    host => "127.0.0.1"
    port => "5044"
  }
}
output{
  elasticsearch {
  hosts => ["localhost:9200"]
  index => "app-%{+YYYY.MM.dd}"
  document_type => "%{[@metadata][type]}"
  }
  stdout { codec => rubydebug }
}
-
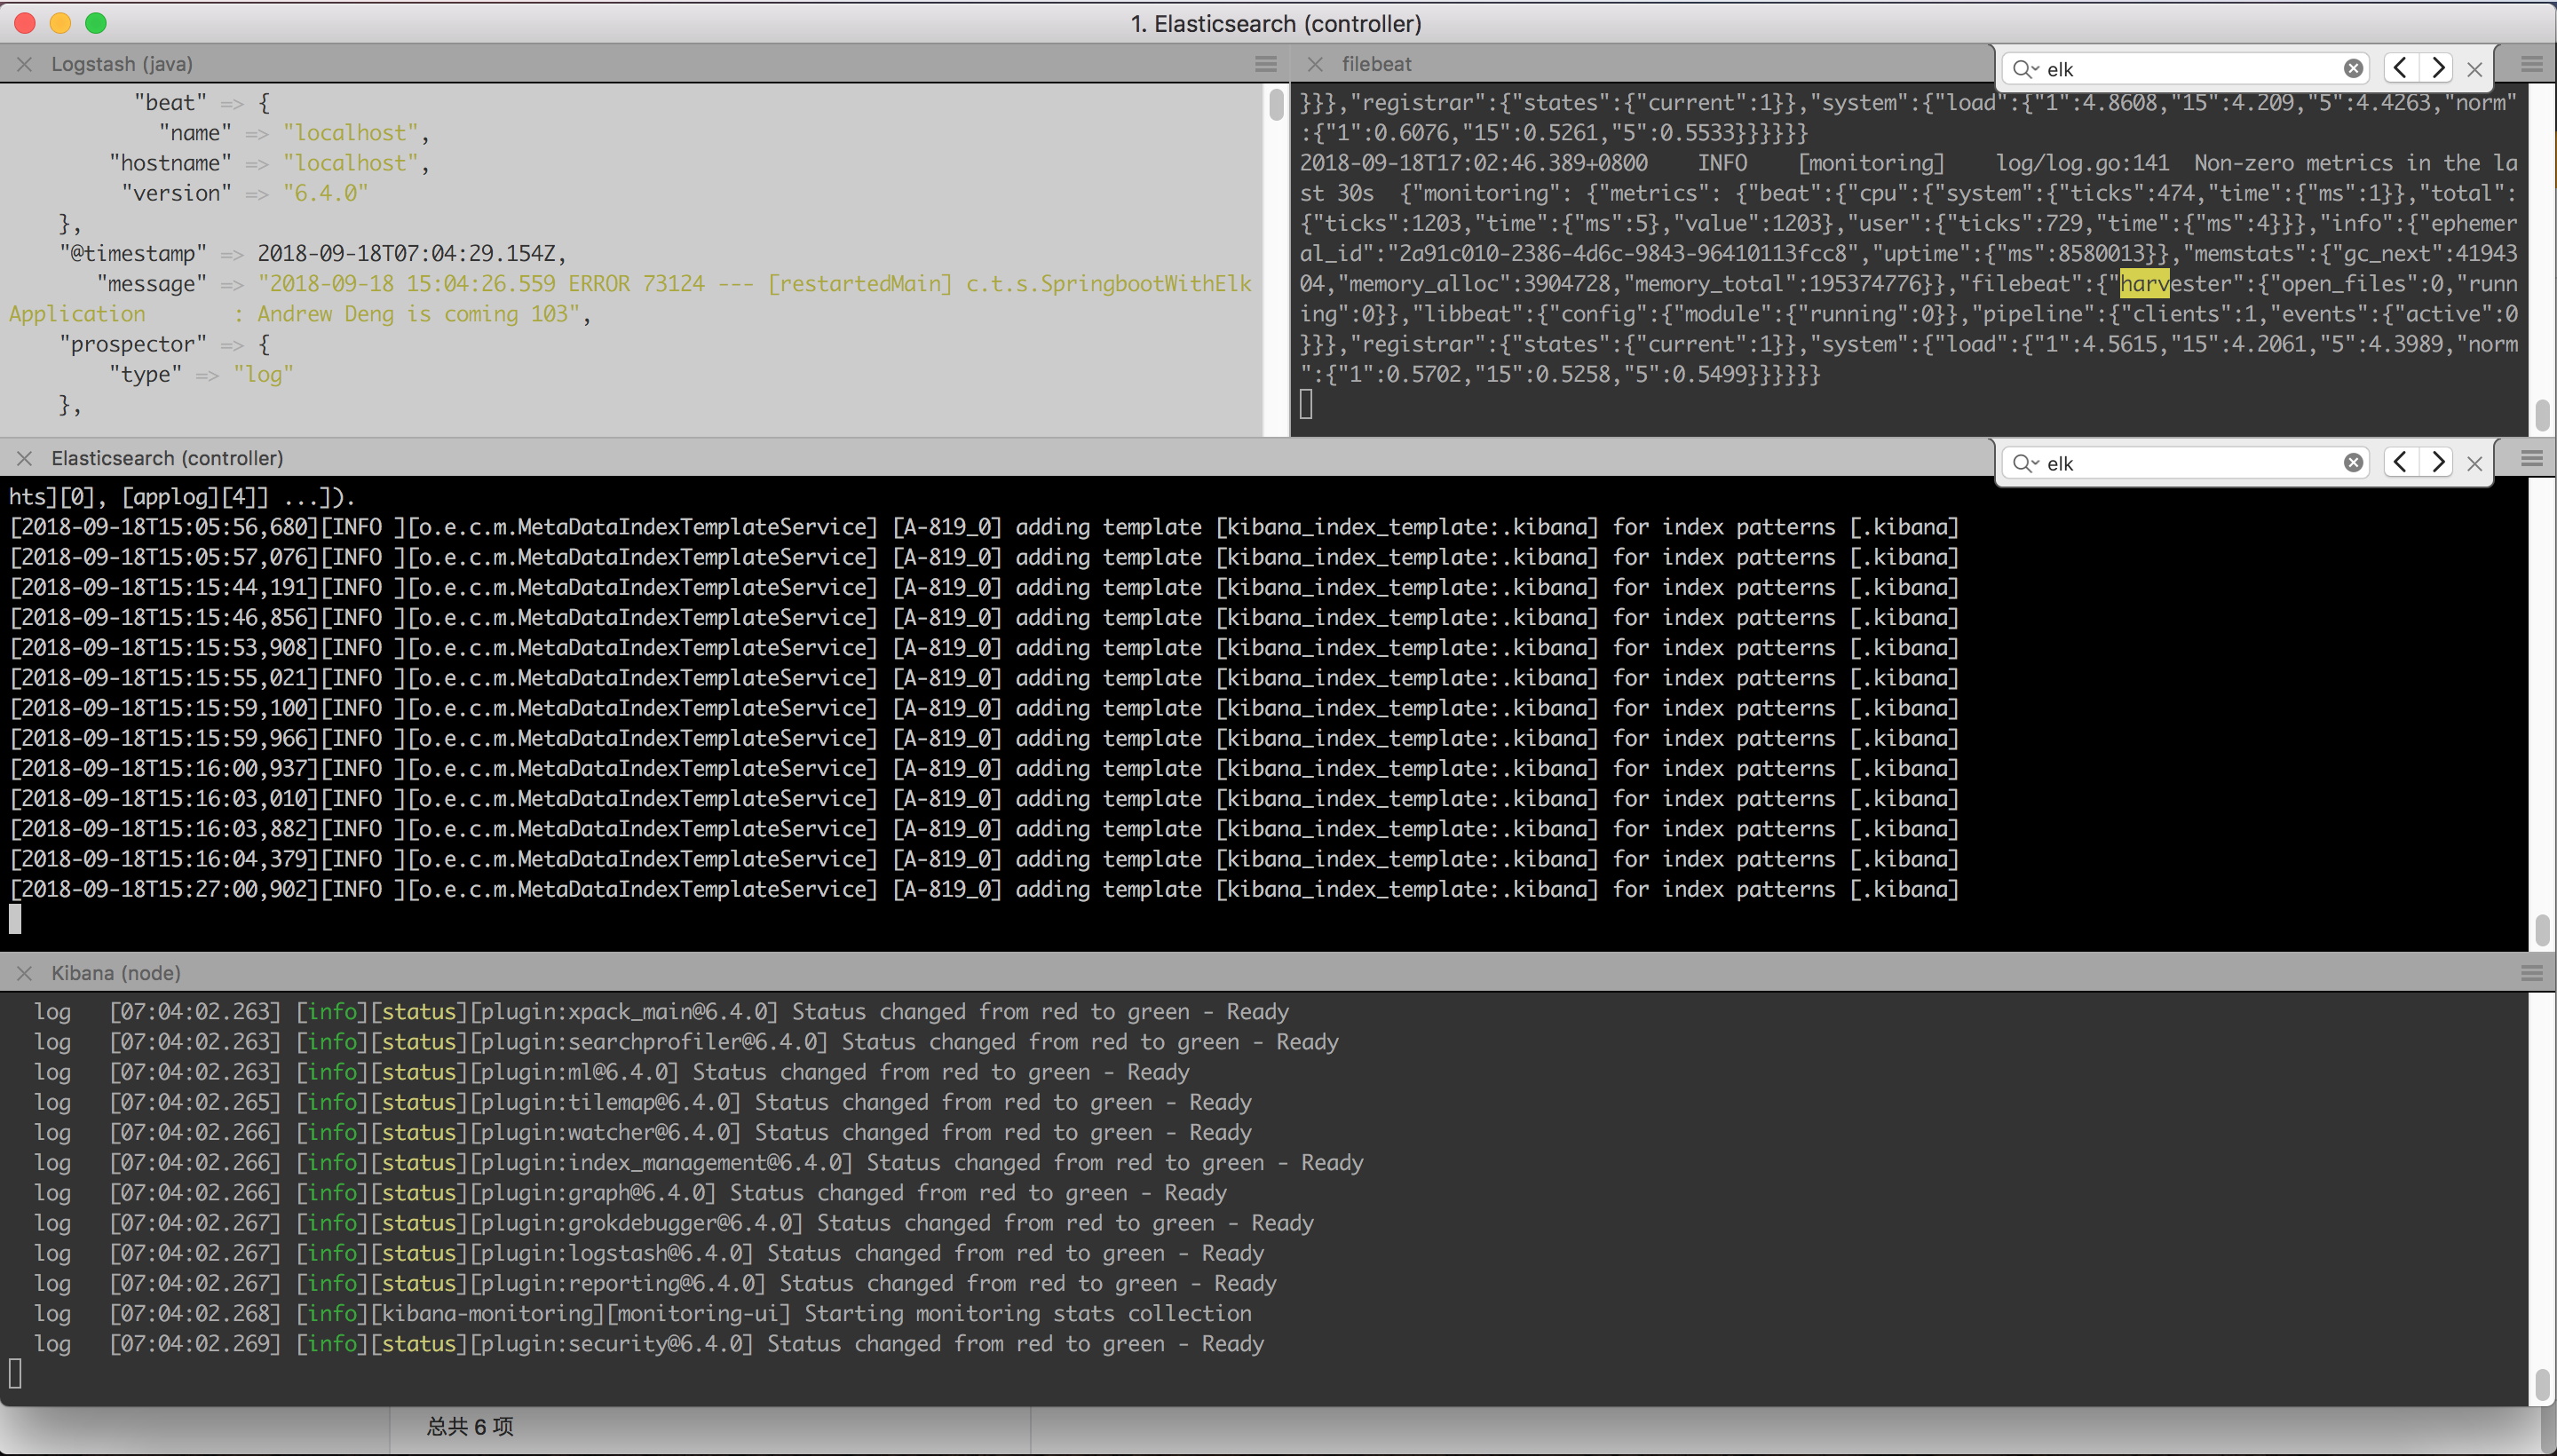
- Below is the file in my Mac:

- Start running Logstash with command
bin/logstash -f springboot-log-demo.conf
- Create a new file spring-boot-log-demo.conf under the /config/ with content below:
- Filebeat
- Modify
filebeat.ymlunder [your path to Filebeat directory]/filebeat.yml with content below: -
filebeat.inputs:

- type: log

enabled: true

paths:
  - /tmp/filebeatDemoApp.log

output.logstash:
hosts: ["localhost:5044"]
- Modify
Running Result
Once everything is done you can browse the Kibana by visiting http://localhost:5601 and you should see below page: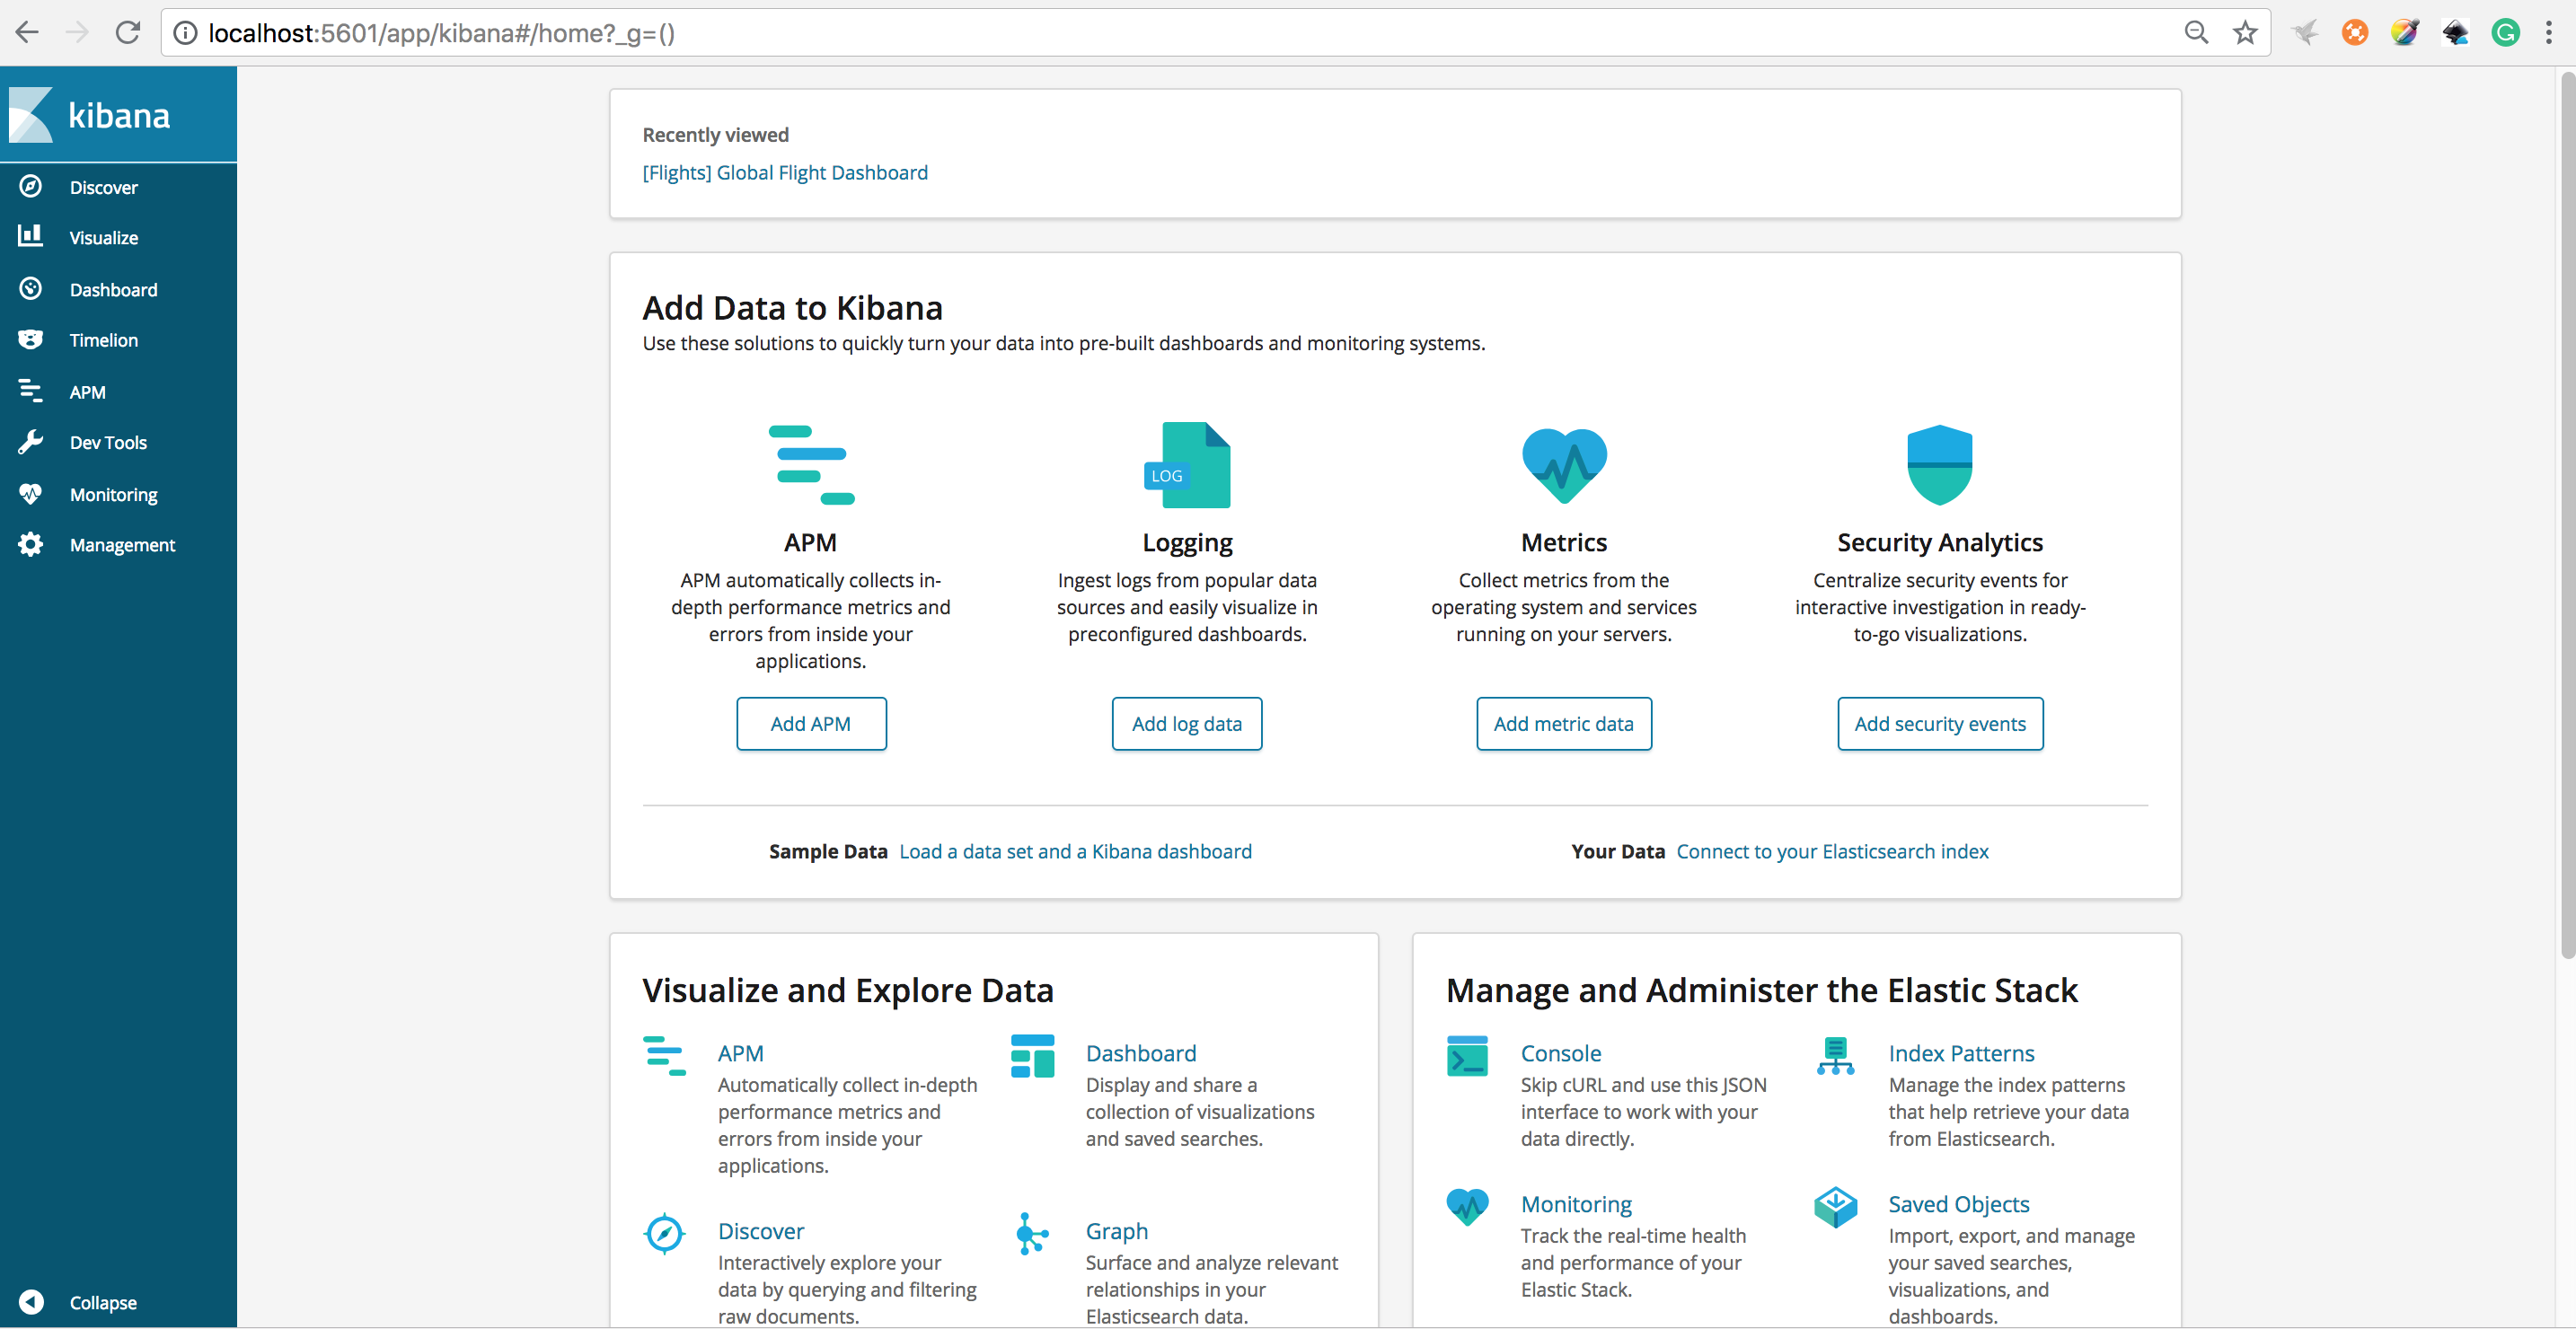
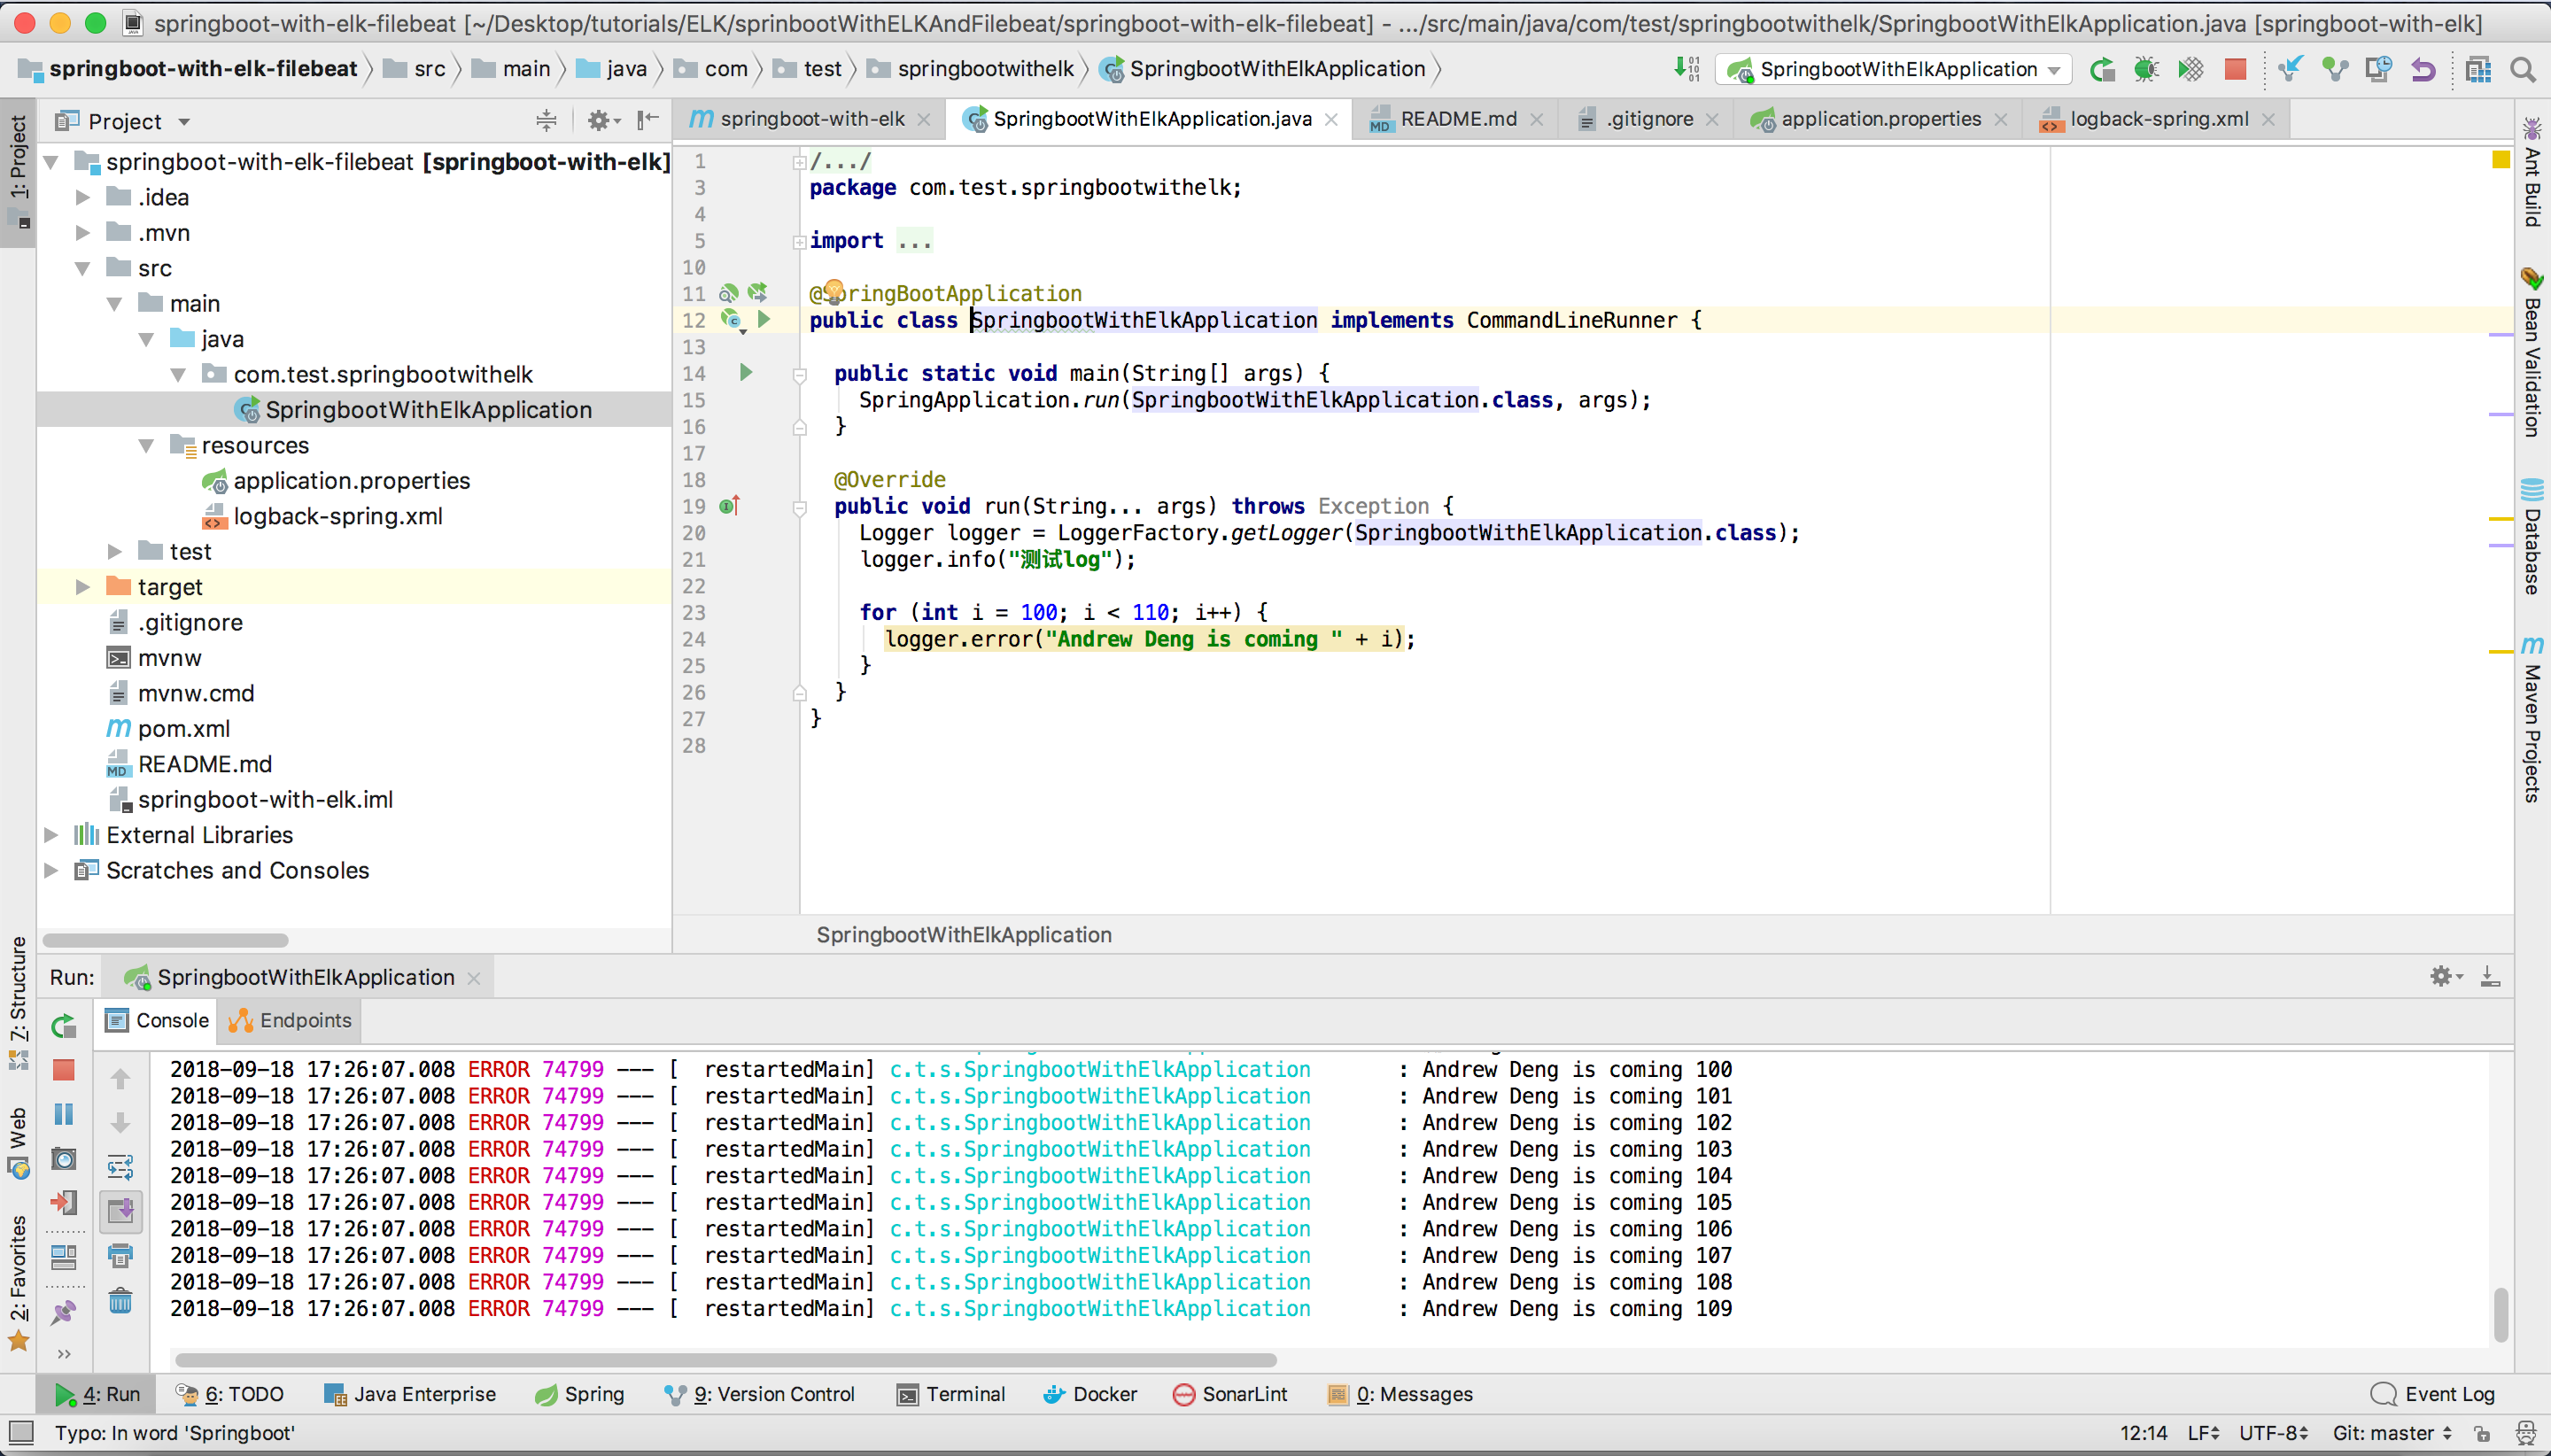
Config Springboot program
Project structure
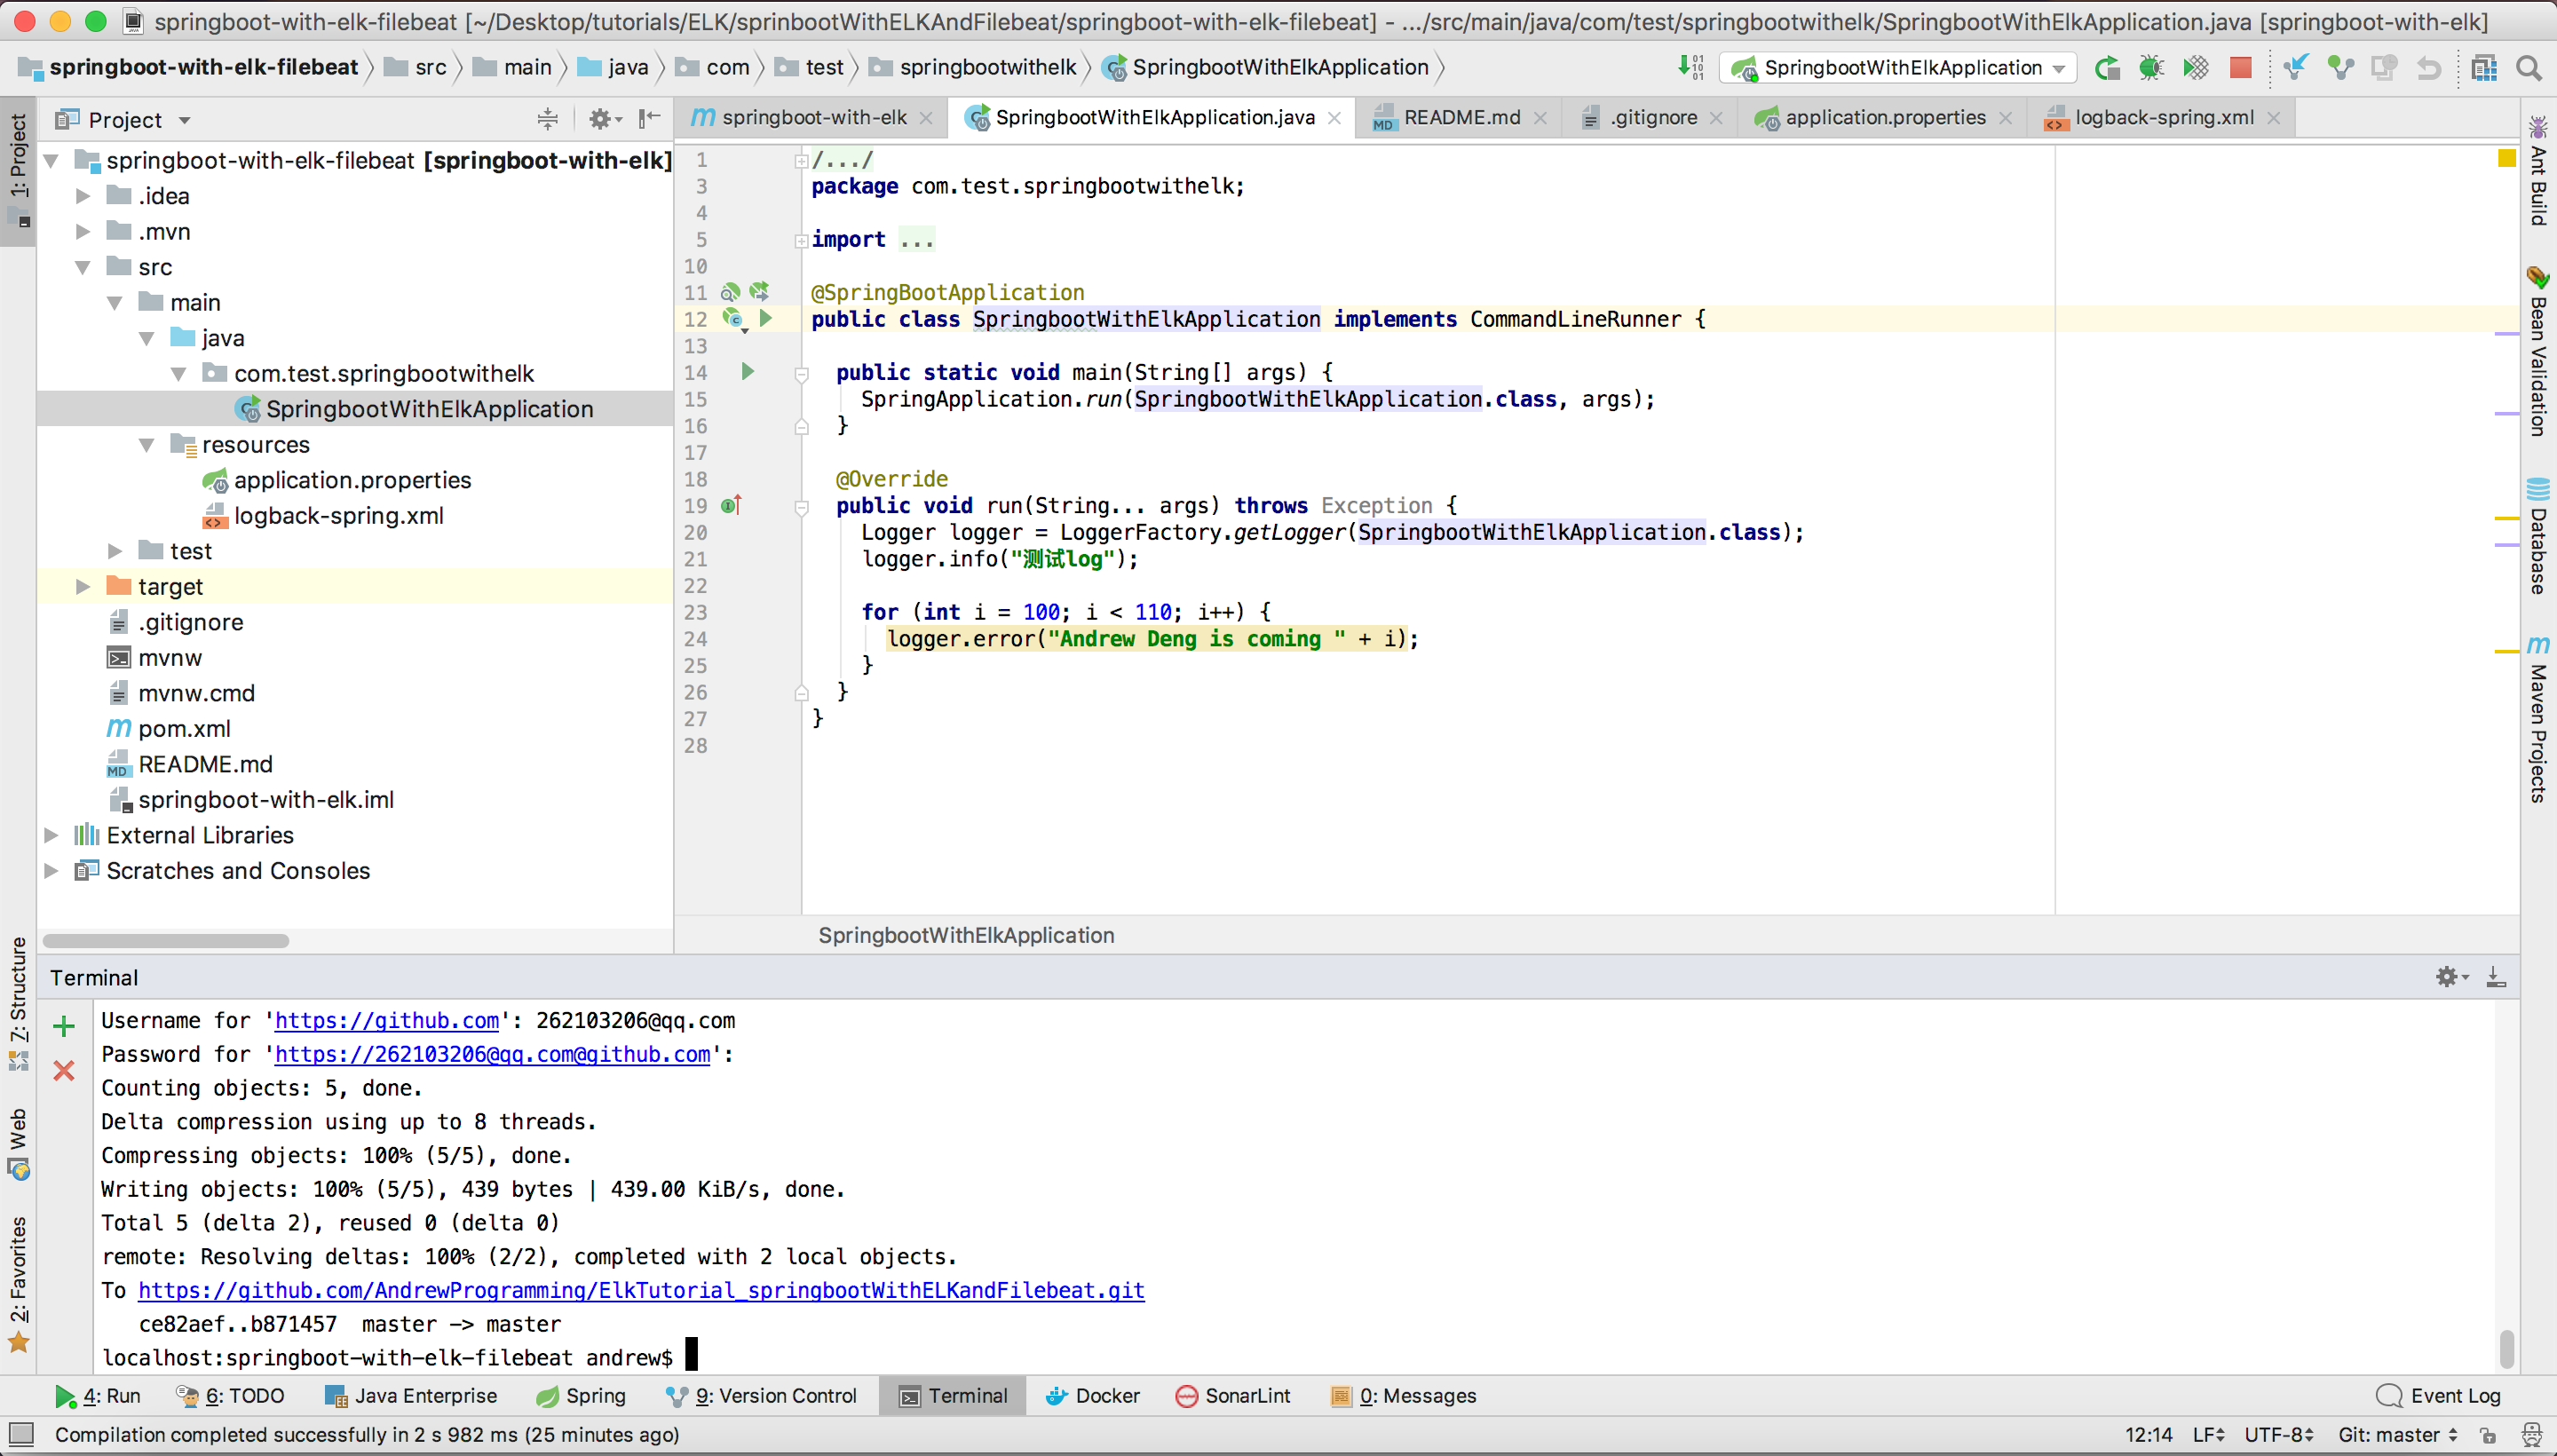
application.properties
logging.file=/tmp/filebeatDemoApp.log
logback-spring.xml
<?xml version="1.0" encoding="UTF-8"?>
<!DOCTYPE configuration>
<configuration>
  <appender name="LOGSTASH" class="net.logstash.logback.appender.LogstashTcpSocketAppender">
    <destination>localhost:4560</destination>
    <encoder charset="UTF-8" class="net.logstash.logback.encoder.LogstashEncoder" />
  </appender>

  <include resource="org/springframework/boot/logging/logback/base.xml"/>

  <root level="INFO">
    <!--<appender-ref ref="LOGSTASH" />-->
    <appender-ref ref="CONSOLE" />
  </root>

</configuration>
pom.xml
<?xml version="1.0" encoding="UTF-8"?>
<project xmlns="http://maven.apache.org/POM/4.0.0" xmlns:xsi="http://www.w3.org/2001/XMLSchema-instance"
 xsi:schemaLocation="http://maven.apache.org/POM/4.0.0 http://maven.apache.org/xsd/maven-4.0.0.xsd">
 <modelVersion>4.0.0</modelVersion>

 <groupId>com.test</groupId>
 <artifactId>springboot-with-elk</artifactId>
 <version>0.0.1-SNAPSHOT</version>
 <packaging>jar</packaging>

 <name>springboot-with-elk</name>
 <description>Demo project for Spring Boot</description>

 <parent>
  <groupId>org.springframework.boot</groupId>
  <artifactId>spring-boot-starter-parent</artifactId>
  <version>2.0.2.RELEASE</version>
  <relativePath/> <!-- lookup parent from repository -->
 </parent>

 <properties>
  <project.build.sourceEncoding>UTF-8</project.build.sourceEncoding>
  <project.reporting.outputEncoding>UTF-8</project.reporting.outputEncoding>
  <java.version>1.8</java.version>
 </properties>

 <dependencies>
  <dependency>
   <groupId>org.springframework.boot</groupId>
   <artifactId>spring-boot-starter-web</artifactId>
  </dependency>
  <dependency>
   <groupId>net.logstash.logback</groupId>
   <artifactId>logstash-logback-encoder</artifactId>
   <version>5.1</version>
  </dependency>
  <dependency>
   <groupId>org.springframework.boot</groupId>
   <artifactId>spring-boot-devtools</artifactId>
   <scope>runtime</scope>
  </dependency>
  <dependency>
   <groupId>org.springframework.boot</groupId>
   <artifactId>spring-boot-starter-test</artifactId>
   <scope>test</scope>
  </dependency>
 </dependencies>

 <build>
  <plugins>
   <plugin>
    <groupId>org.springframework.boot</groupId>
    <artifactId>spring-boot-maven-plugin</artifactId>
   </plugin>
  </plugins>
 </build>

</project>
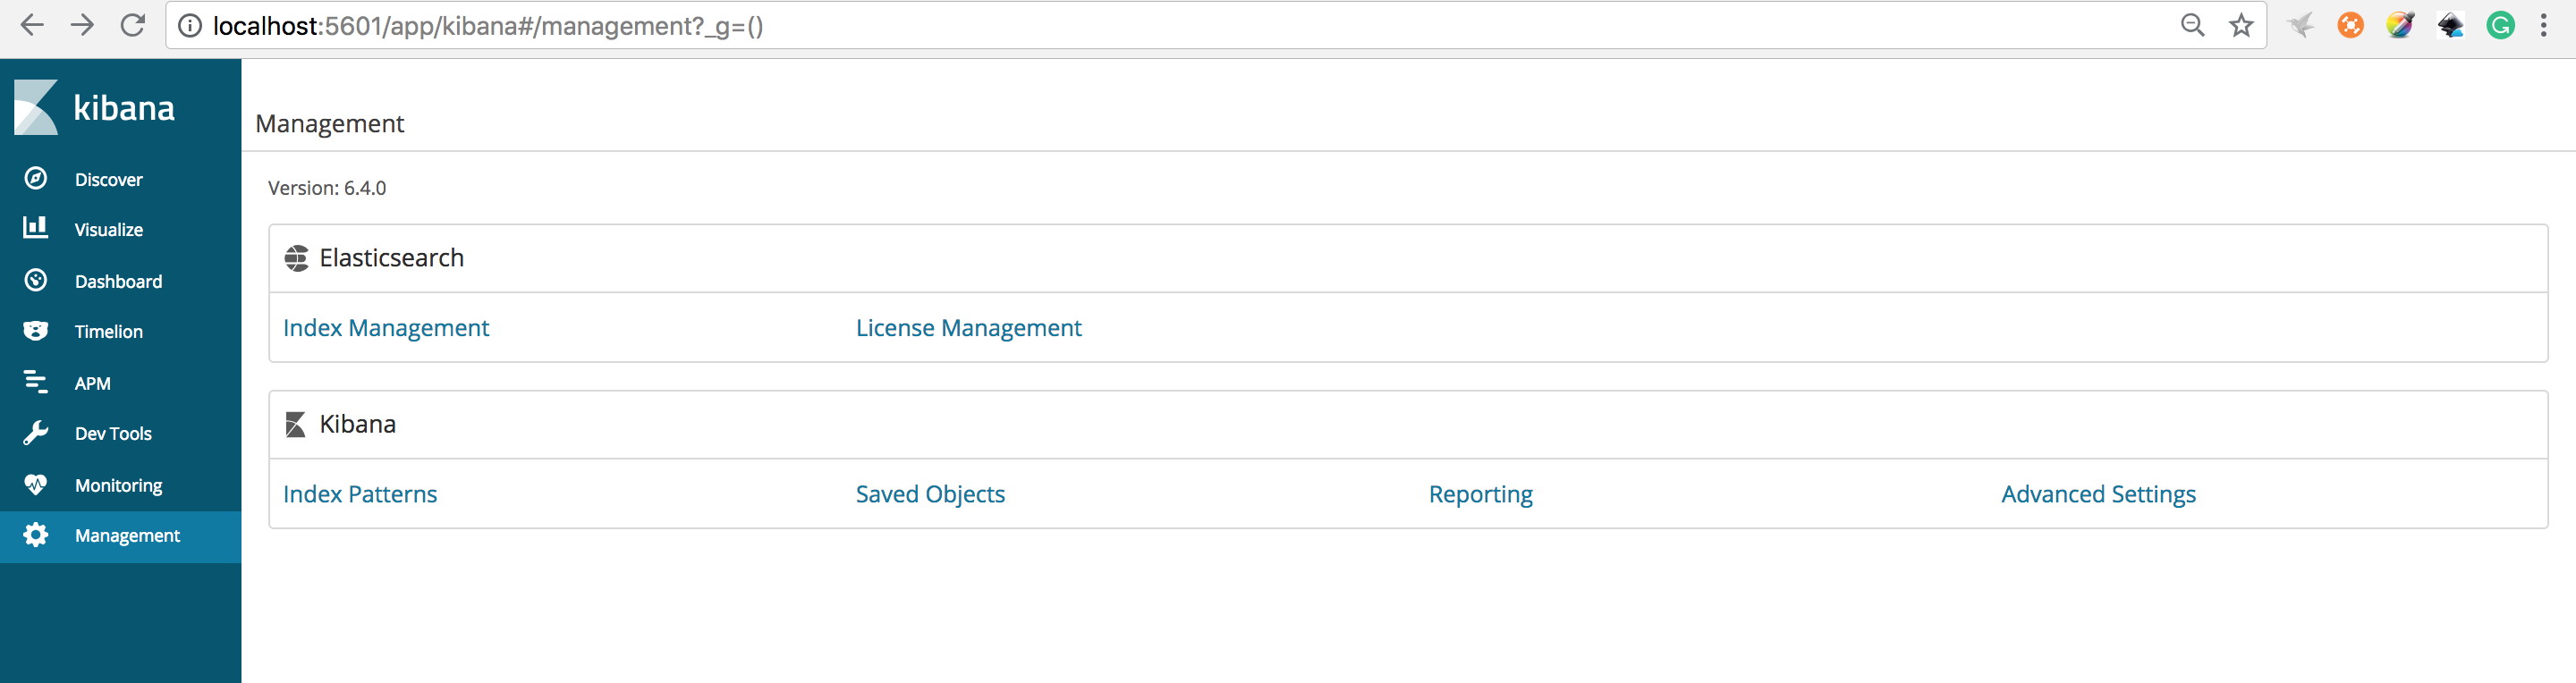
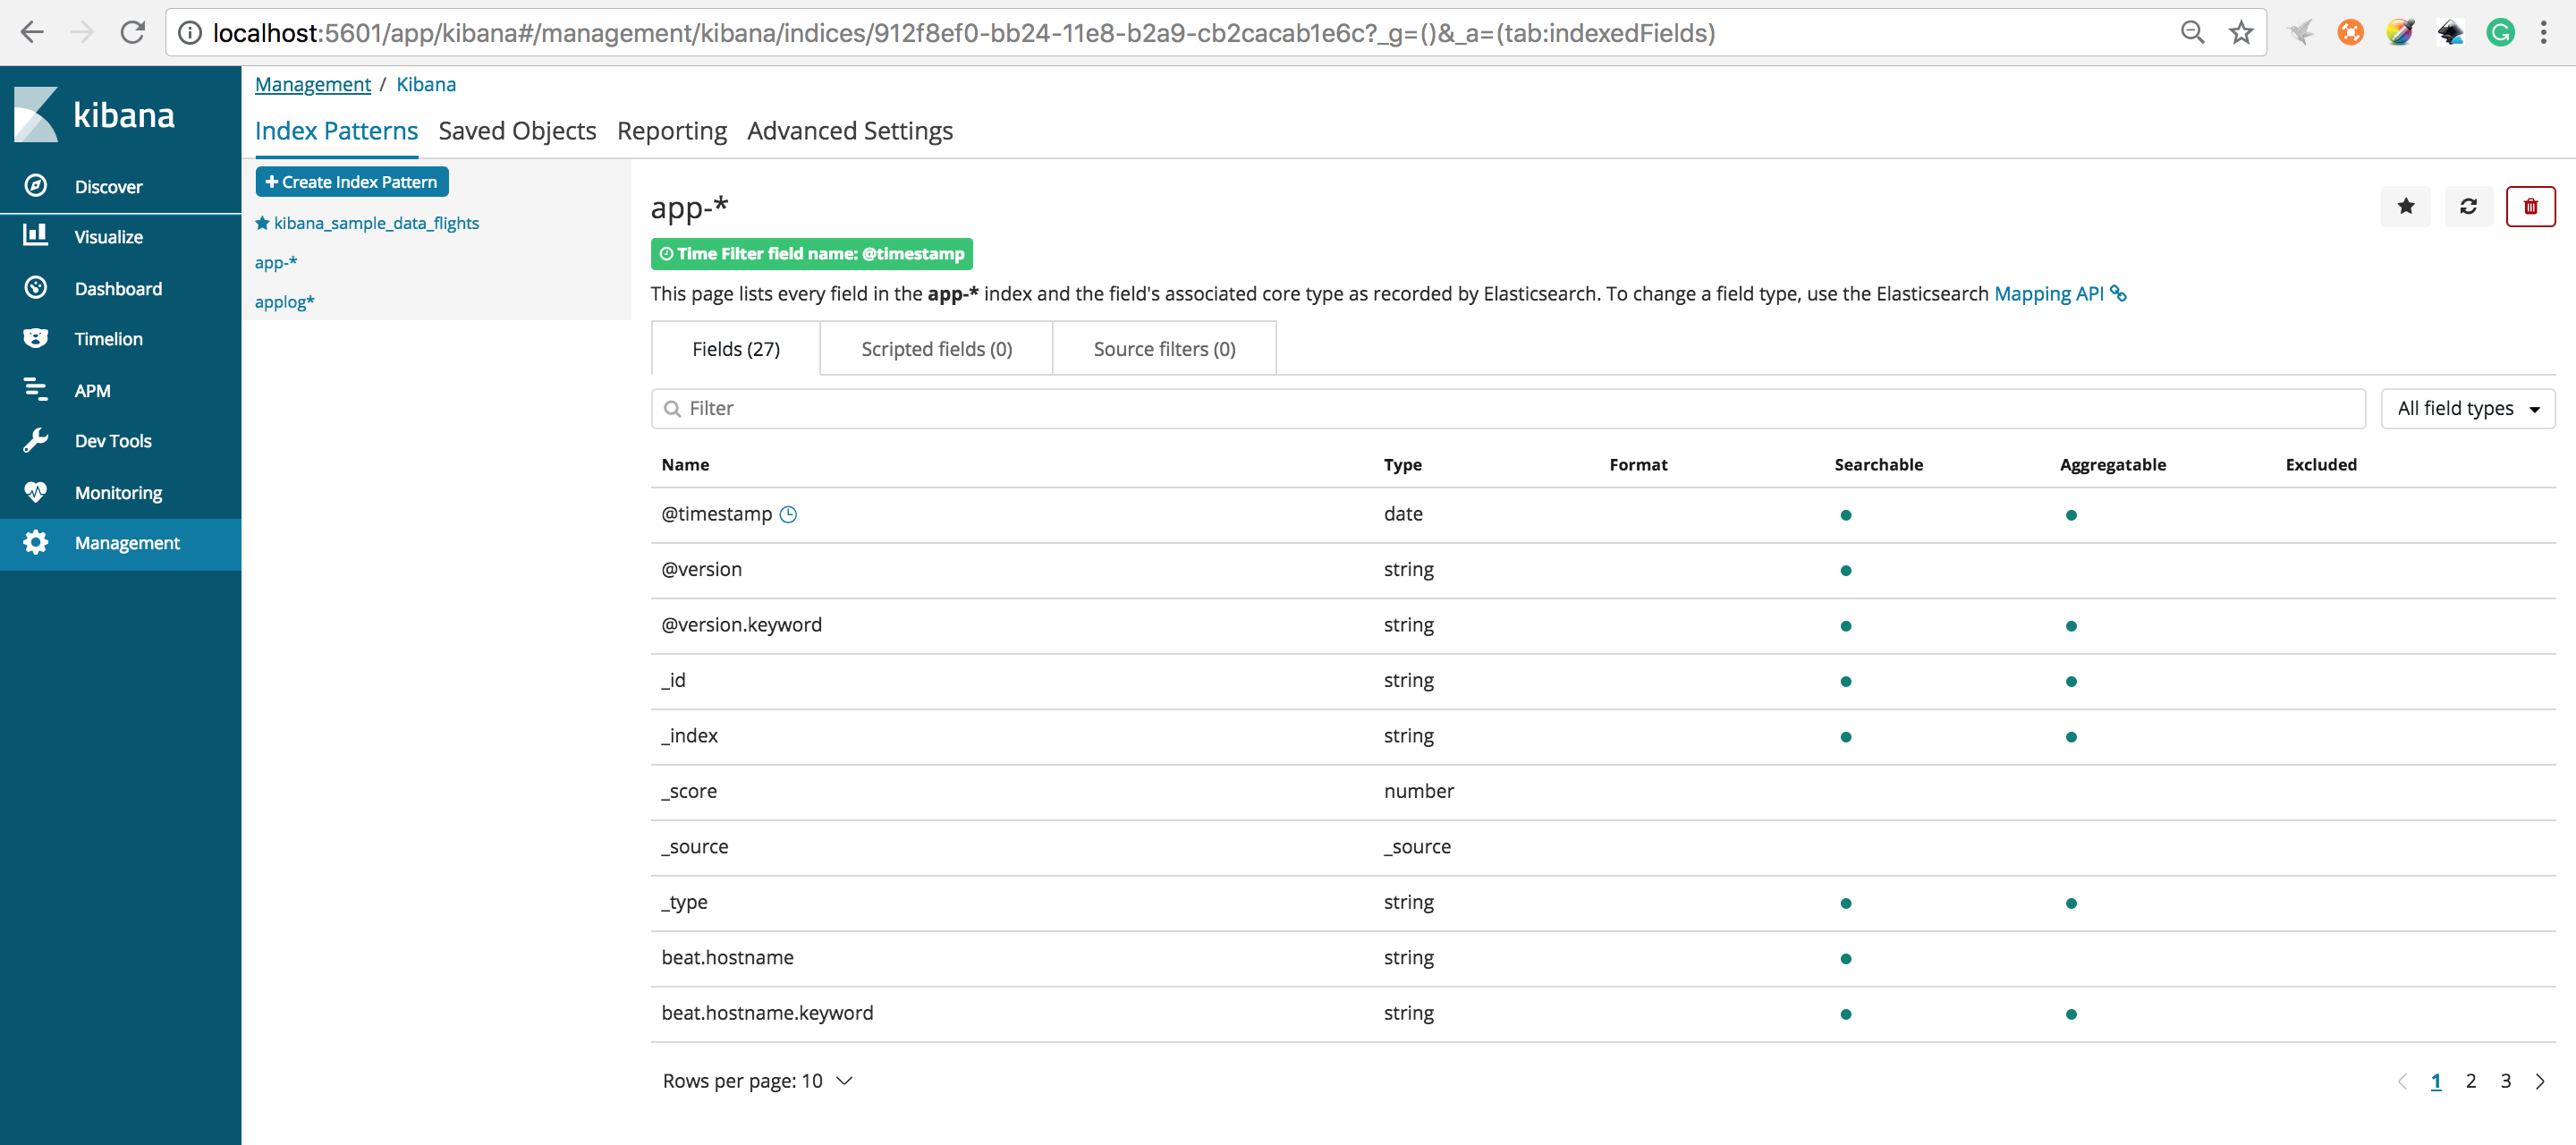
Config Kibana
Open Kibana at http://localhost:5601 and create a new index for the application and choose Management->index Patterns->Create Index Pattern
Type app-* in the textbook and then click Next step
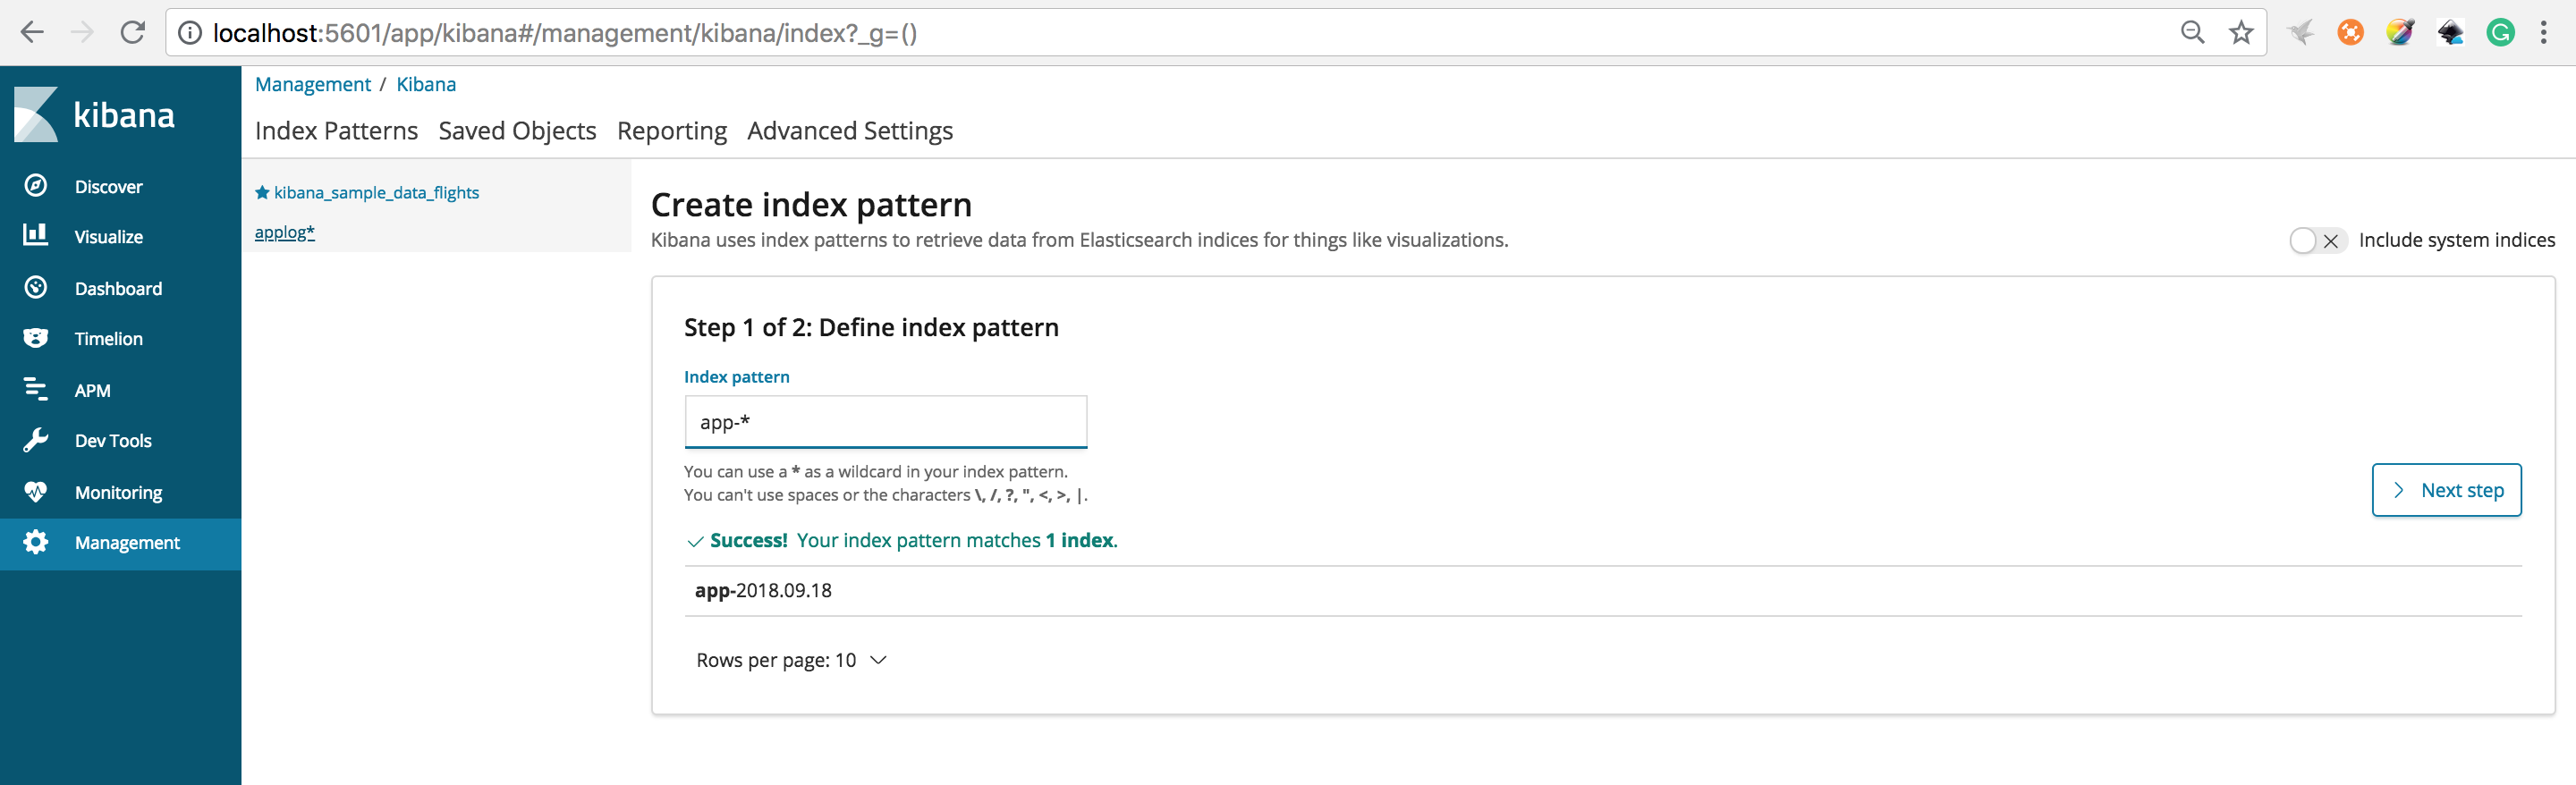
Choose Next step
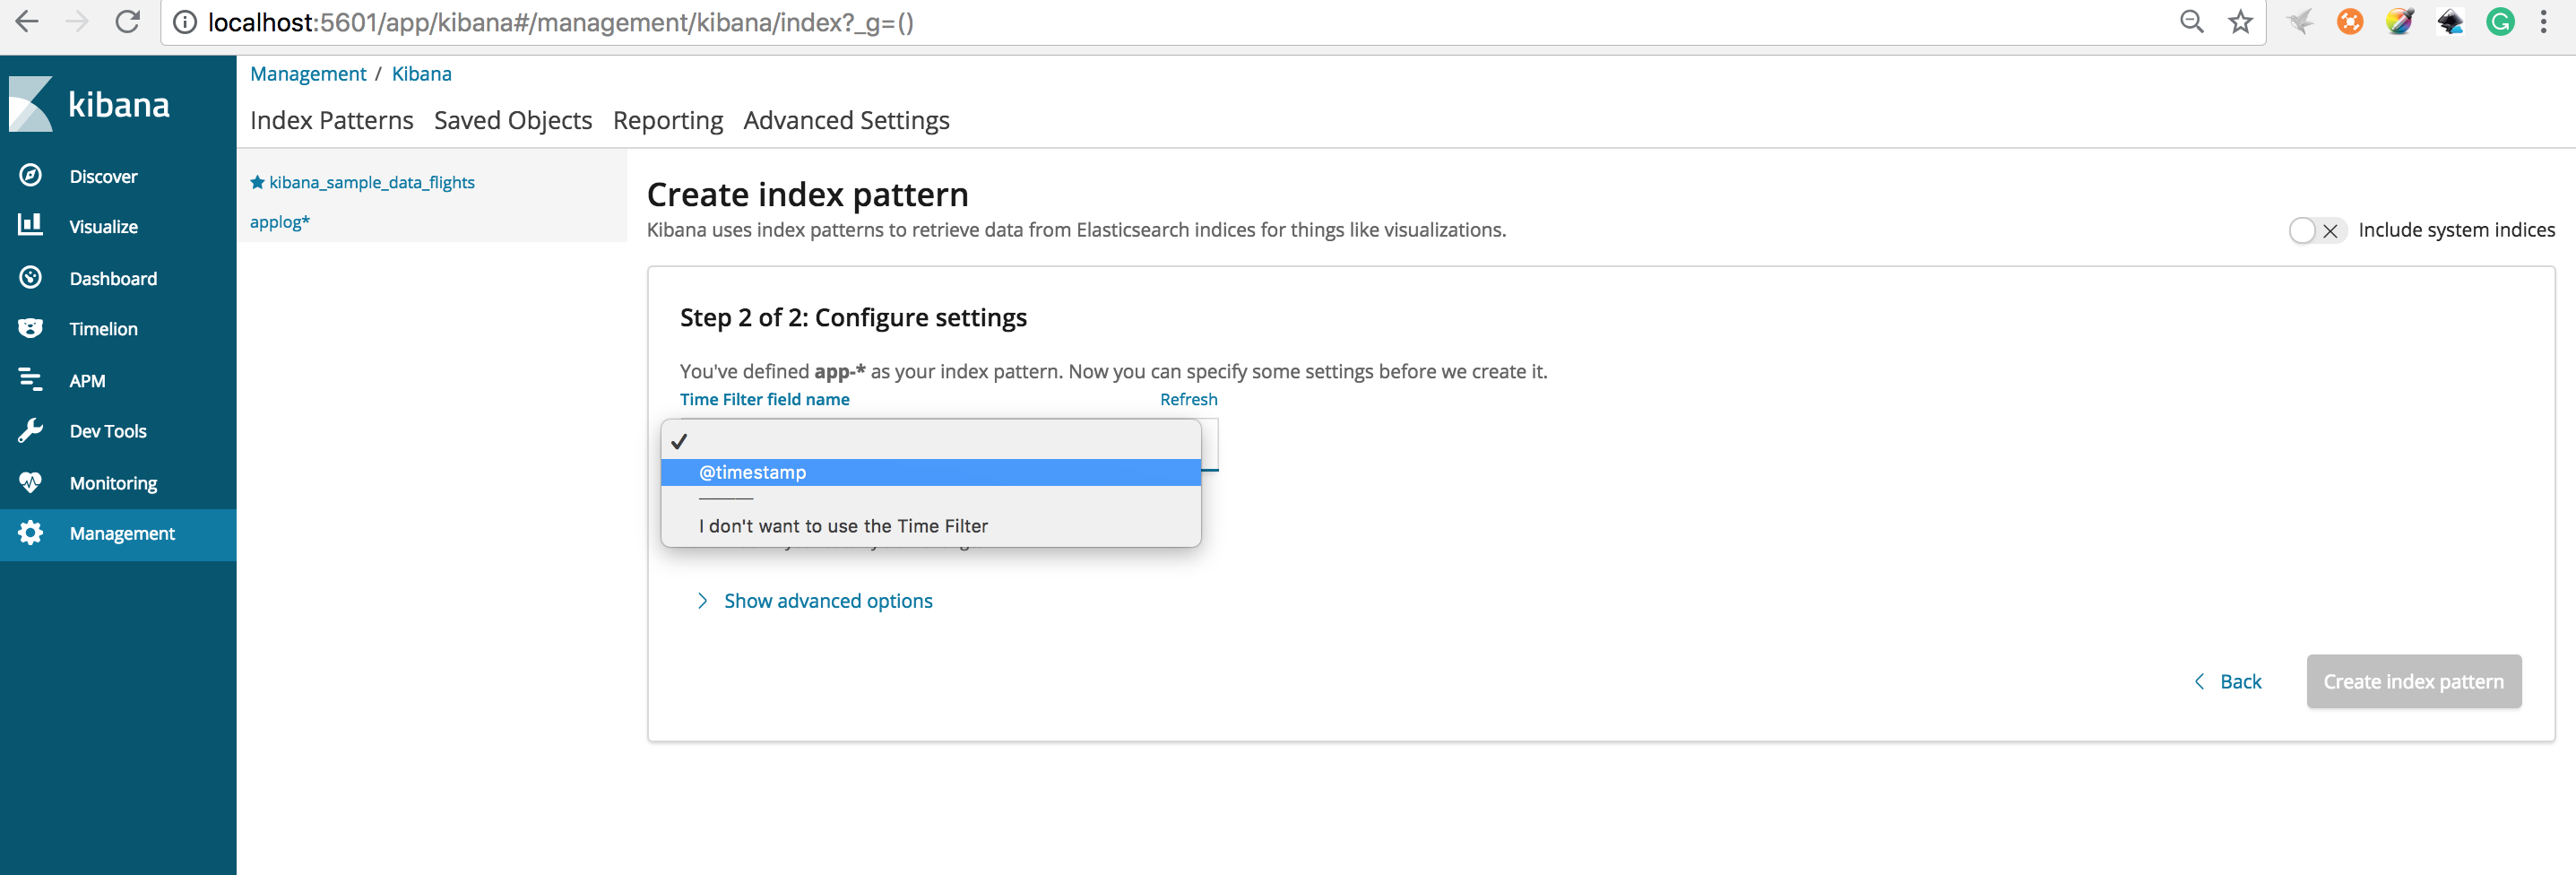
Choose @timestamp and click Create index pattern you should see this below
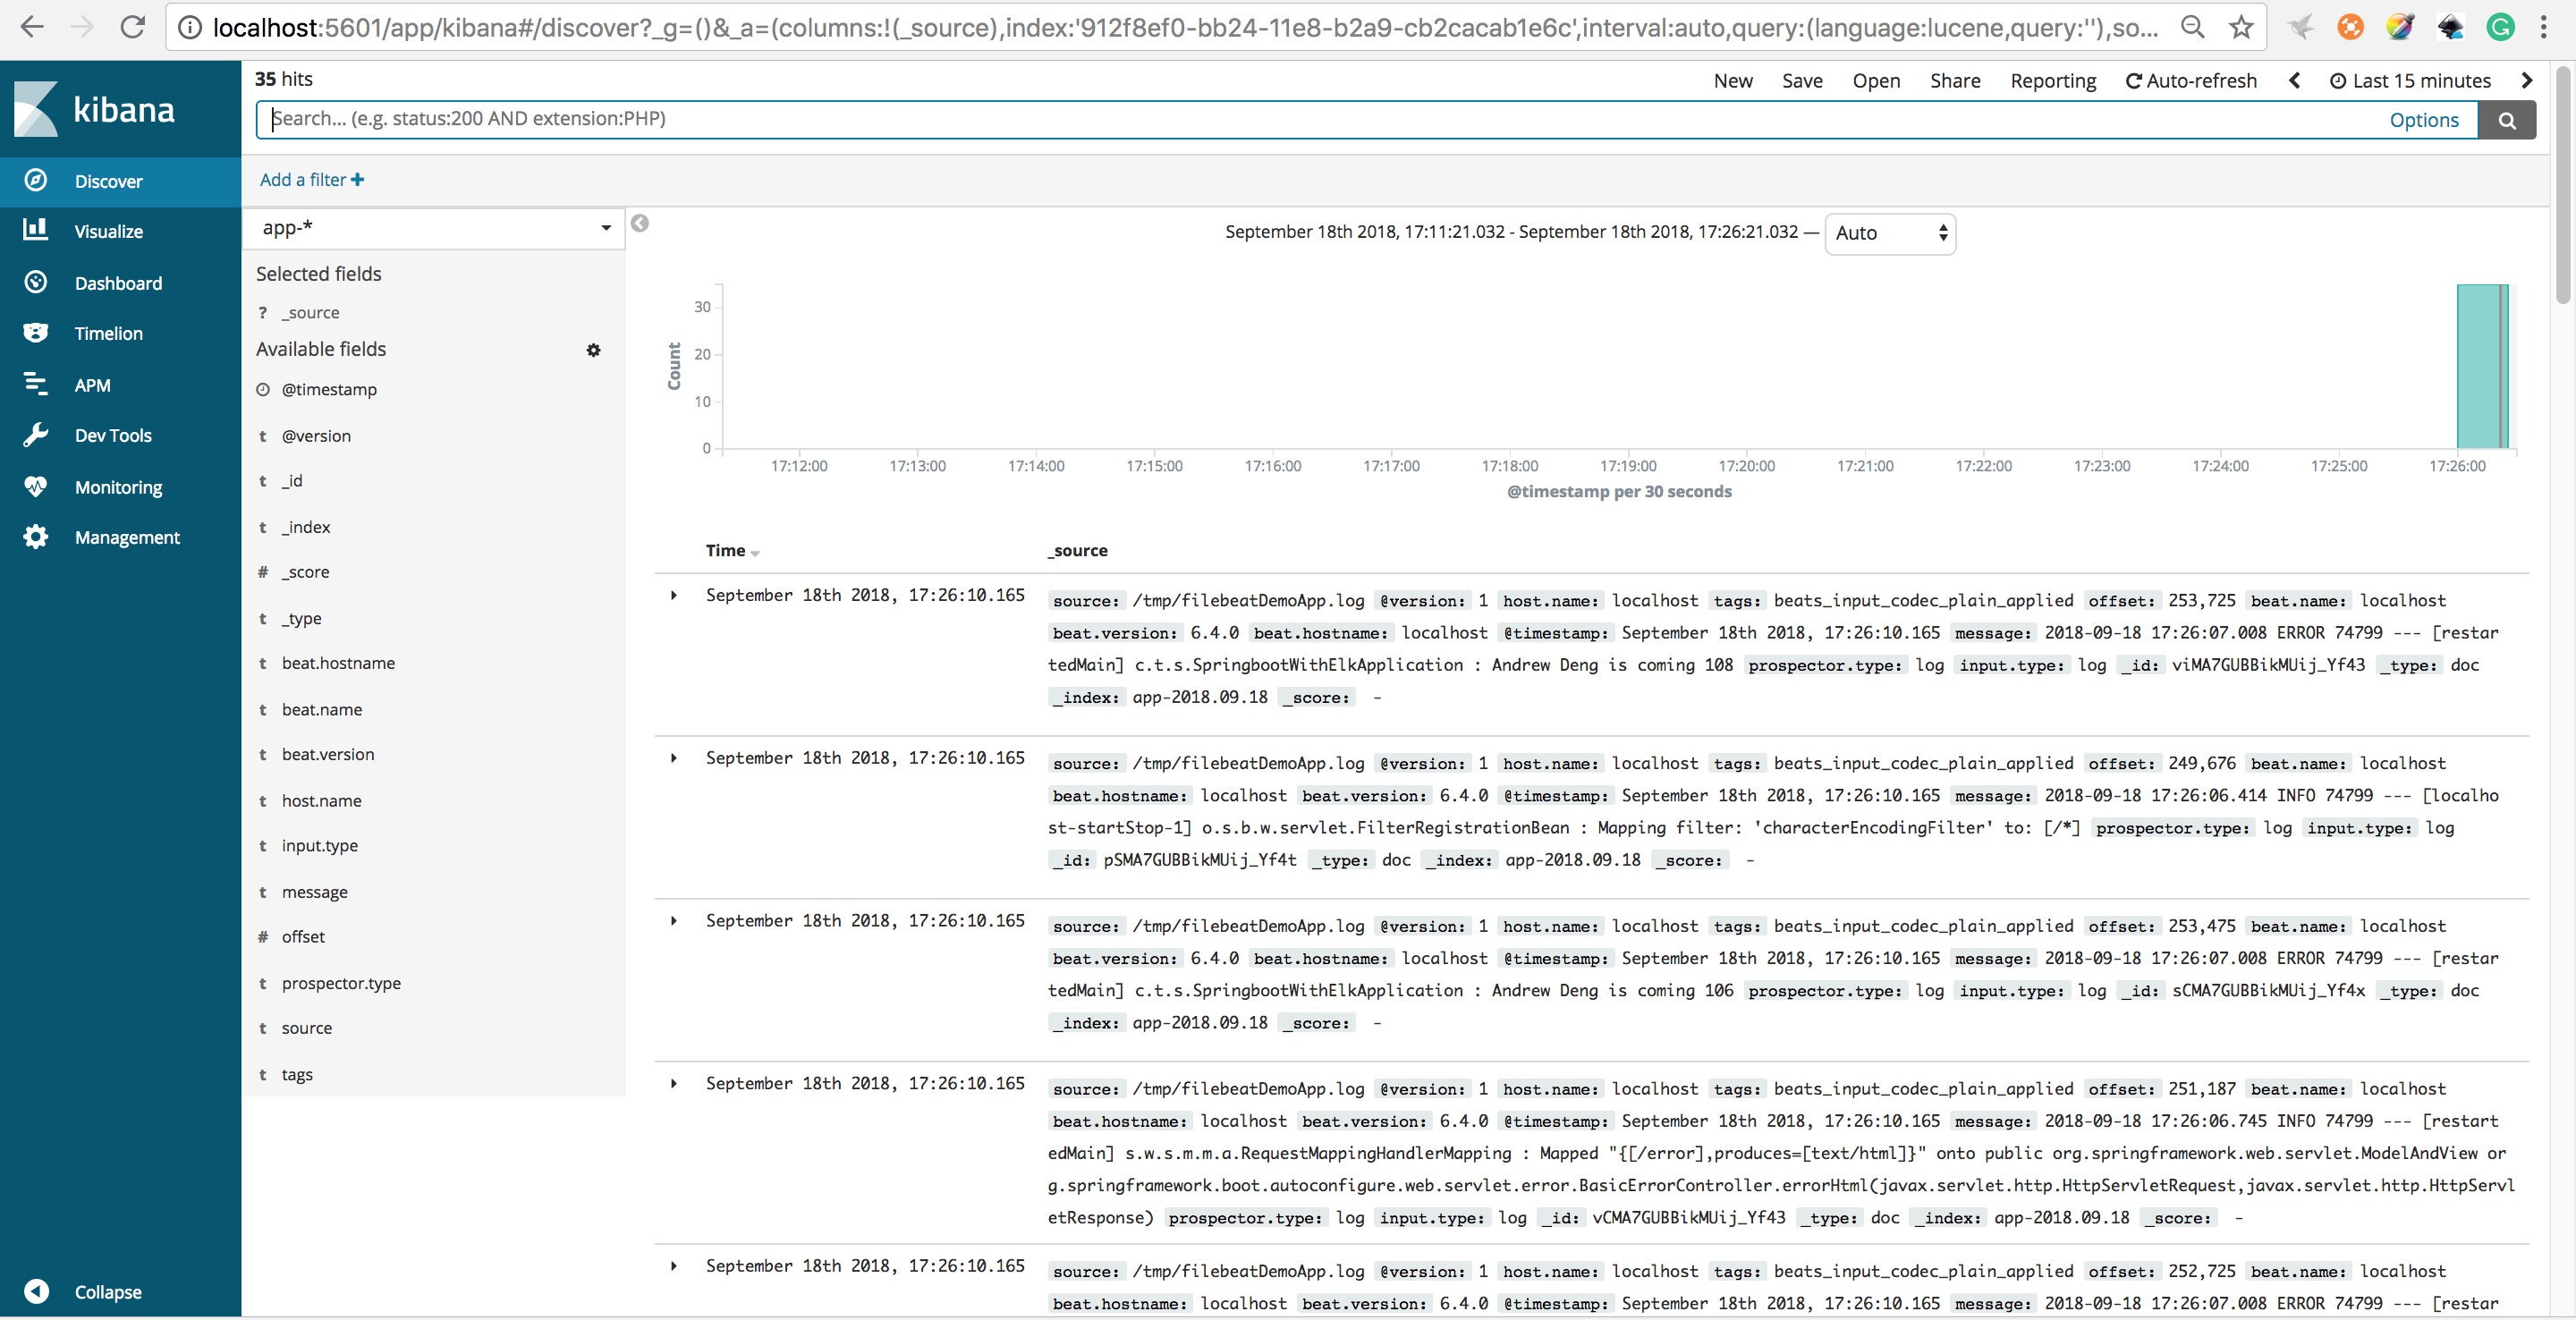
Running the application to generate some log messages
Check the result in Kibana
Binh Thanh Nguyen
23 Jan 2019Thanks, nice tip
kobe73er
23 Jan 2019Glad this helps you!
Michael
14 Mar 2019I’m having trouble creating an index pattern keep getting – Couldn’t find any Elasticsearch data
You’ll need to index some data into Elasticsearch before you can create an index pattern.
Any ideas?
Michael
15 Mar 2019Hi, I am having issues getting this working, I cannot create an index pattern in kibana because it couldnt find any data, any ideas?
kobe73er
17 Mar 2019Make sure you use the right index pattern to filter your data
bez
24 Apr 2019The above example does not use filebeat. The applications logs are directly sent to logstash.
kobe73er
28 Apr 2019No.It use filebeat to send log messages to logstash
bez
24 Apr 2019The example above does not use filebeats, the application logs seem to be sent directly to logstash over tcp.
localhost:4560
The logback-spring.xml states the logs to be sent to logstash and not using filebeats.
kobe73er
28 Apr 2019No.It use filebeat to send log messages to logstash
bez
24 Apr 2019The example above does not use filebeats, the application logs seem to be sent directly to logstash over tcp.
The logback-spring.xml states the logs to be sent to logstash and not using filebeats.
kobe73er
28 Apr 2019No.It use filebeat to send log messages to logstash
Satya
14 May 2019The above comment is right not using filebeats. In logstash config file
input {
tcp {
port => 4560
codec => json_lines
}
beats {
host => “127.0.0.1”
port => “5044”
}
}
and within the Java application in logback.xml
localhost:4560
It clearly states that the logs are pushed to the poirt on which the logstash is listening. To confirm, I shutdown filebeats container but can still see the logs on kibana getting refreshed. The logback.xml needs to have a file or console appender and the file beat needs to read from that log folder.
bez
15 May 2019Can you explain what is the filebeats doing here. After the docker-compose up, I shut down the filebeats container, but can still see the logs getting refreshed through Kibana, without filebeats.
Nathan
29 May 2019The example does not use filebeats collect application logs send to logstash.
What
29 Dec 2019Are you still not agree “Kobe73er”, that you doesn’t use filebeat here?